3.26. Metabolome 2024
- Dataset Category
Metabolome
- Summary
Metabolome analysis results derived from approximately 73,000 Japanese individuals
- References
- Samples analyzed
Plasma
- # of samples and analysis platform
Category
Analysis platform
人数
NMR
NMR (Bruker: 600MHz),CryoProbe SampleJet69,129LC-MS/G-Met v1
C18 column: UHPLC-Q-TOF/MS (Waters: Synapt G2-Si),HILIC column: HPLC-Q-FT/MS (Thermo Fisher Scientific: QExactive)1,264
LC-MS/G-met v2
HPLC-Q-FT/MS (Thermo Fisher Scientific: QExactive)
2,969
LC-MS/T-Met
UHPLC-MS/MS (Thermo Fisher Scientific: TSQ Quantiva)
2,362
LC-MS/kit180
UHPLC-MS/MS (Waters: Xevo TQ-S) [Biocrates: AbsoluteIDQ®p180]
1,482
LC-MS/kit500
UHPLC-MS/MS (Waters: Xevo TQ-XS) [Biocrates: MxP®Quant 500]
13,822
GC-MS/T-Met
GC-MS/MS (Shimadzu: TQ8040)
4,606
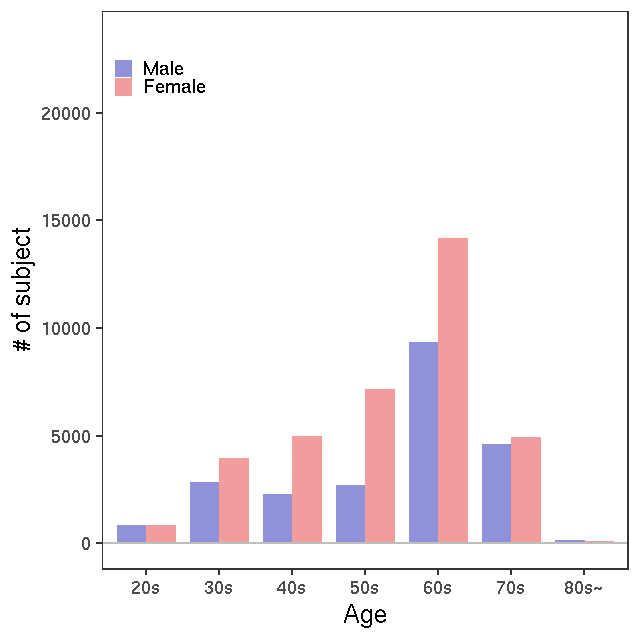
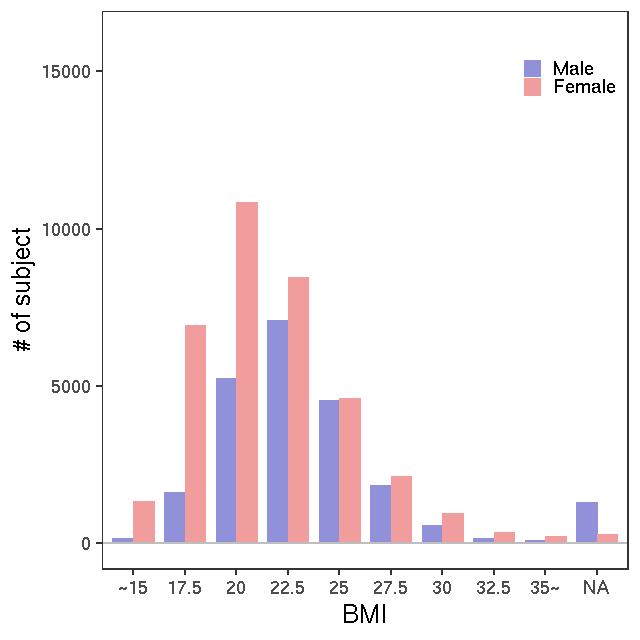
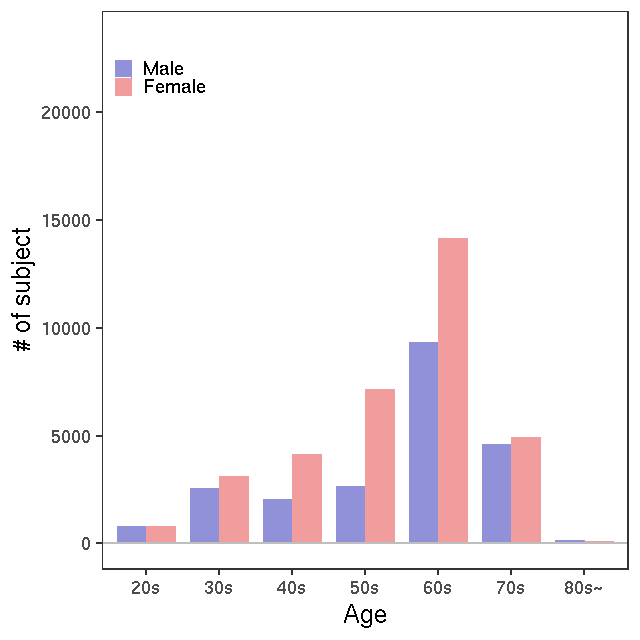
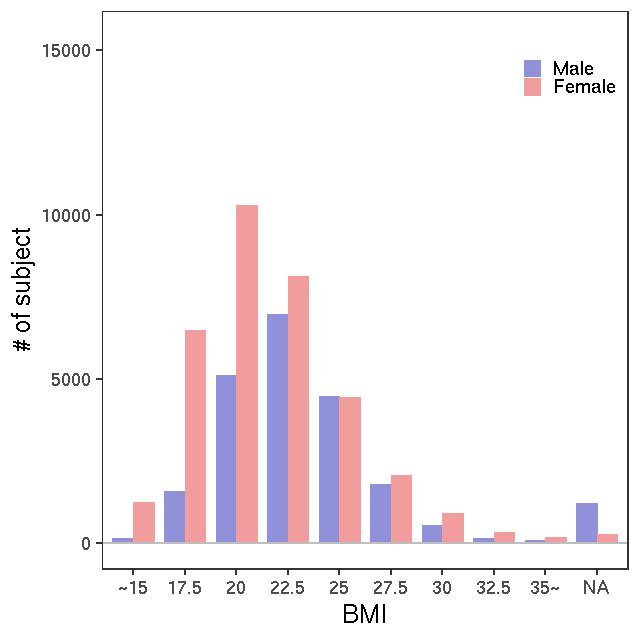
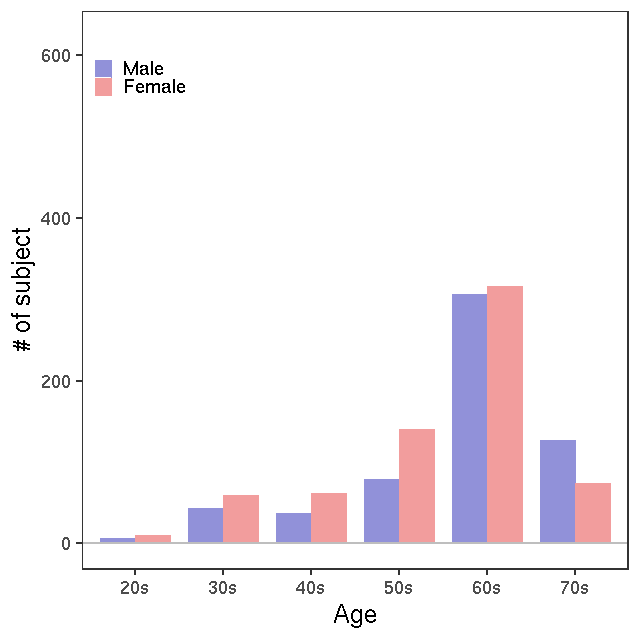
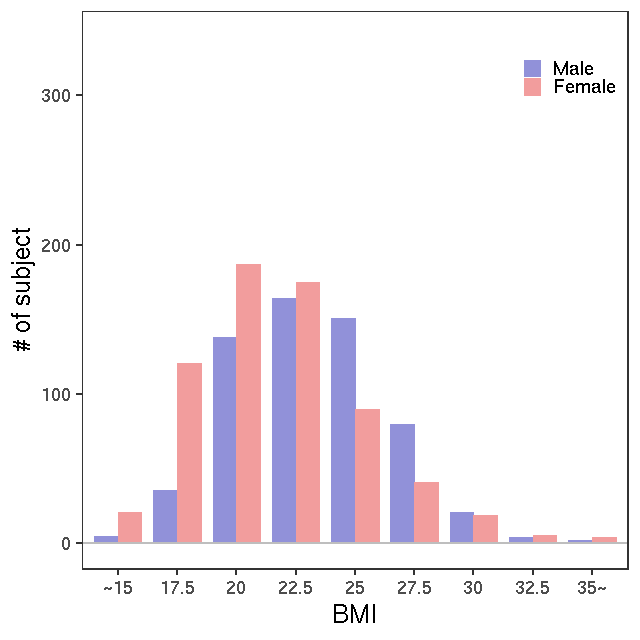
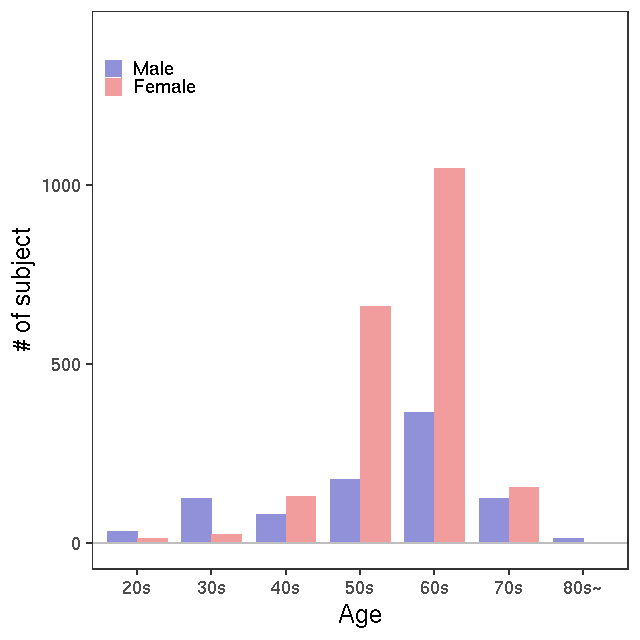
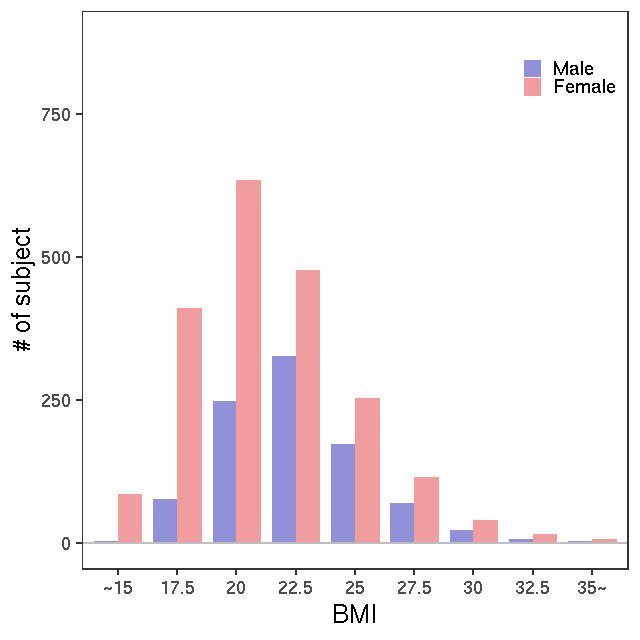
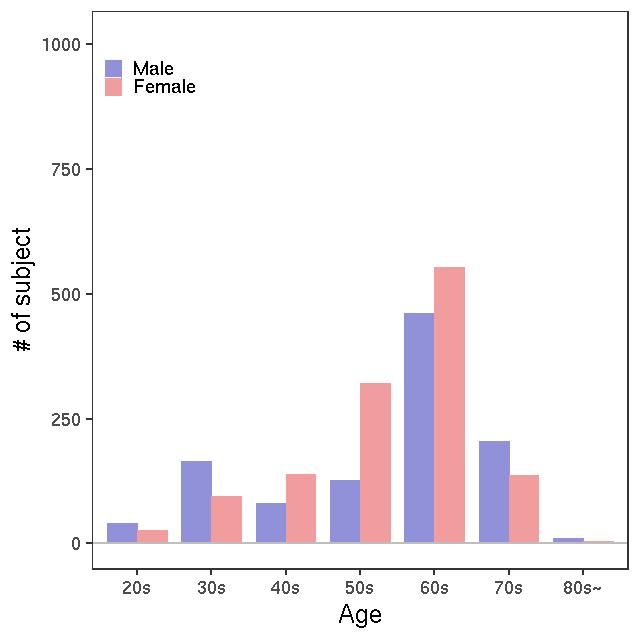
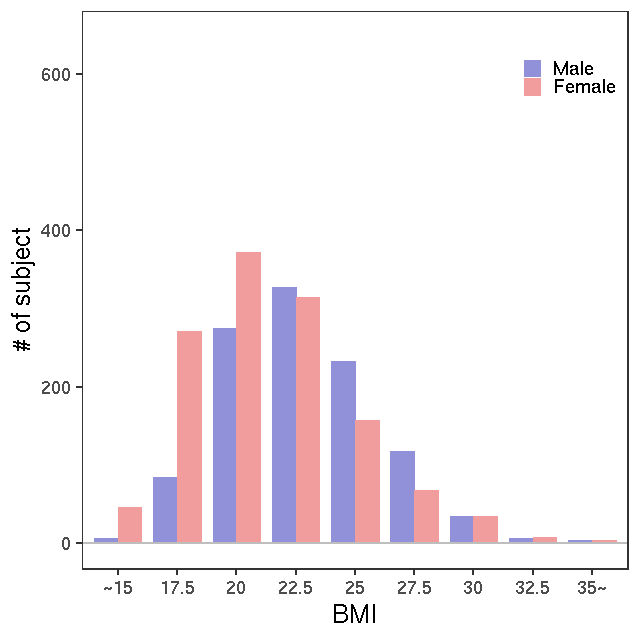
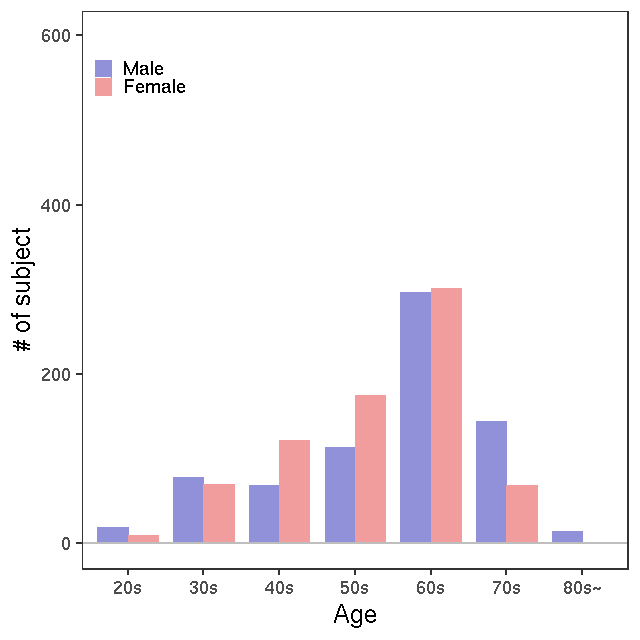
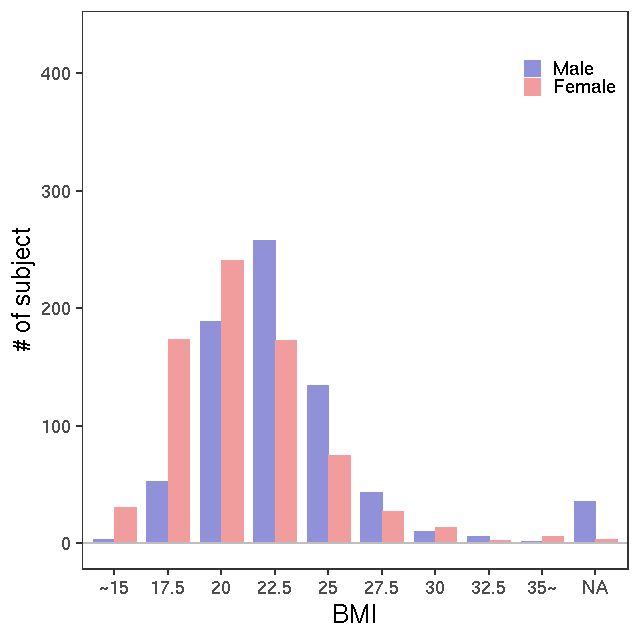
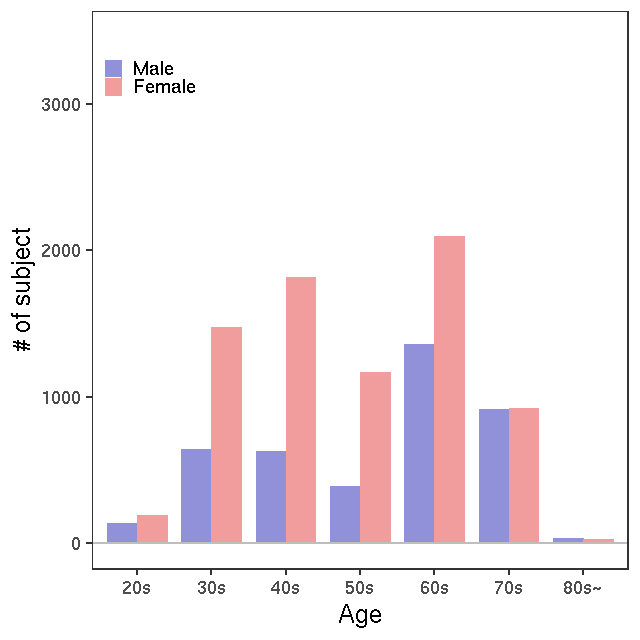
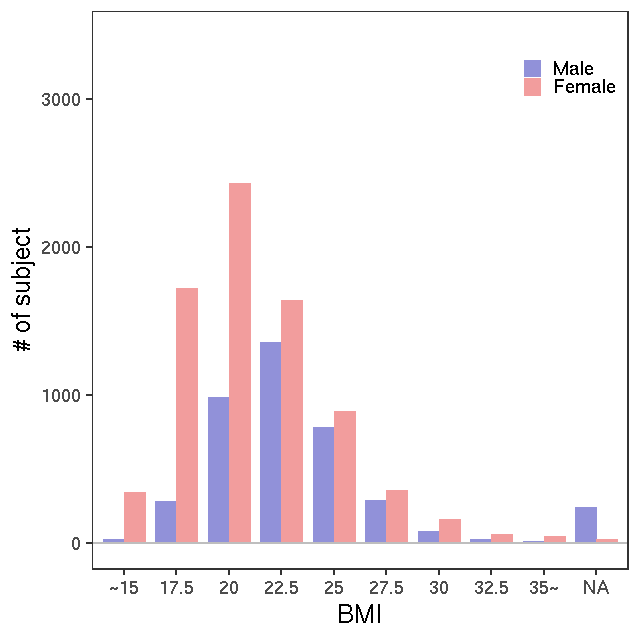
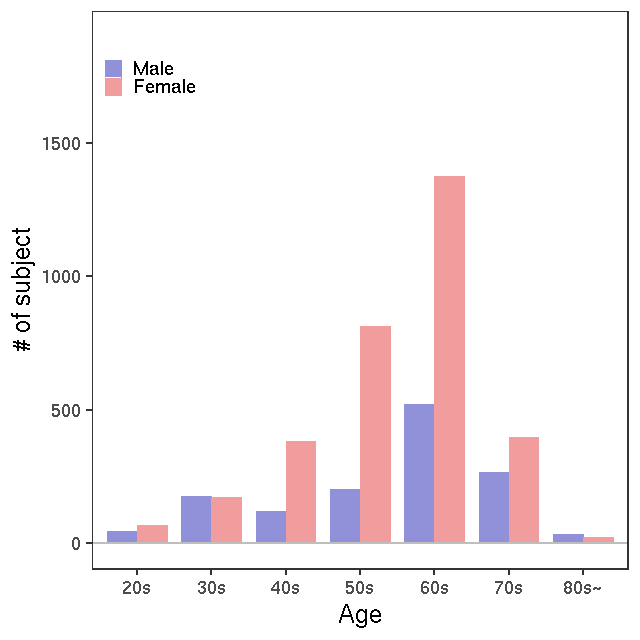
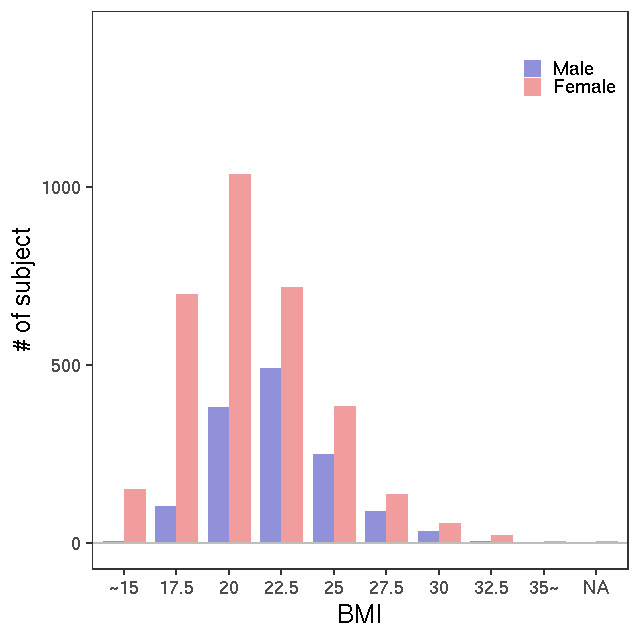
- Age / BMI distributions (non pregnant)
Category
Age distribution
BMI distribution
All
NMR
LC-MS/G-Met v1
LC-MS/G-met v2
LC-MS/T-Met
LC-MS/kit180
LC-MS/kit500
GC-MS/T-Met
- Rule of metabolite ID convension
Metabolites in this dataset are assigned metabolite IDs in the form of TCx123456. The first two characters (TC) stands for ToMMo Compound ID (TC-ID). The third letter indicates how the metabolite is measured, and is divided as follows:
Prefix
Meaning
TCN
NMR
TCZ
LC-MS G-Met metabolome in HILIC mode ver.1 using HPLC
TCI
LC-MS G-Met metabolome in HILIC mode ver.2 using UHPLC
TCO
LC-MS G-Met metabolome in C18 mode using UHPLC
TCL
LC-MS T-Met metabolome
TCB
LC-MS T-Met metabolome in kit180
TCM
LC-MS T-Met metabolome in kit500
TCS
GC-MS T-Met metabolome
The last six digits are numbers assigned to each metabolite within each data source. In MS metabolome, data sources can be further divided into positive and negative modes. A number less than 500,000 indicates that the metabolite was detected in negative mode; otherwise, it is a metabolite detected in positive mode.
- Automatic quantification of metabolites
The concentrations of metabolites were automatically estimated from NMR spectra by using several regression models. Based on more than 1,000 concentration data carefully calculated by experts, both linear regression model and neural network model were built for each metabolite. We selected the model with best performance by using R-squared (R2) values as an evaluation index. We provide a reliability score of estimated concentration on a four-tiered scale: “Triple Stars (★★★)”, “Double Stars (★★☆)”, “Single Star (★☆☆)” and “Zero Star (☆☆☆)”. Each category corresponds to R2 value >=0.9, >=0.7, >=0.6, and <0.6, respectively. Outliers were defined by this protocol as those concentration is >10 SD after automatically estimation and were excluded in each compound.
- Note related to Hypoxanthine and Inosine
Because values of metabolites, (TCN000044, TCI006689, TCS000091, TCO501589, TCZ000947) and Inosine (TCN000045, TCI010703), strongly depend on the stored time until specimen processing for banking, values of the samples that were not processed on the day were excluded for these two metabolites.
- About postprandial change plot
Postprandial Changes in plasma metabolite level of metabolome 2024 dataset. Only participants between the ages of 60 and not 70 were included in the plot. Participants with a time interval exceeding 10 hours since their last meal are included in the “10<” group. Participants for whom the time interval from the last meal is unavailable are categorized into the “Unknown” group. The number of boxes was determined in 30-minute increments to ensure that the number of participants exceeded 50. In cases where this wasn’t achievable, the boxes were categorized into three groups: 0-5, 5-10, and 10<.
- About metabolic index
Metabolite concentrations of metabolome 2024 dataset were used to create an index stratified by age and sex. Data were analysed only on samples from the same day from collection to processing and storage, with the exception of pregnant women. Age was divided into 13 groups of 5 years each, with those aged 80 years and over grouped into one group to ensure that there were not too few people in the group compared to the other groups.
- Related pages on jMorp website