2.9. Metabolite Correlation Network Viewer
A tool to view metabolite correlations as a network is implemented in jMorp. The Metabolite Correlation Network Viewer is what it is. The usage of this tool is covered in this section.
2.9.1. How to launch the Metabolite Correlation Network Viewer
The Correlation between other metabolites panel on the Metabolite page allows you to access the correlation network viewer.
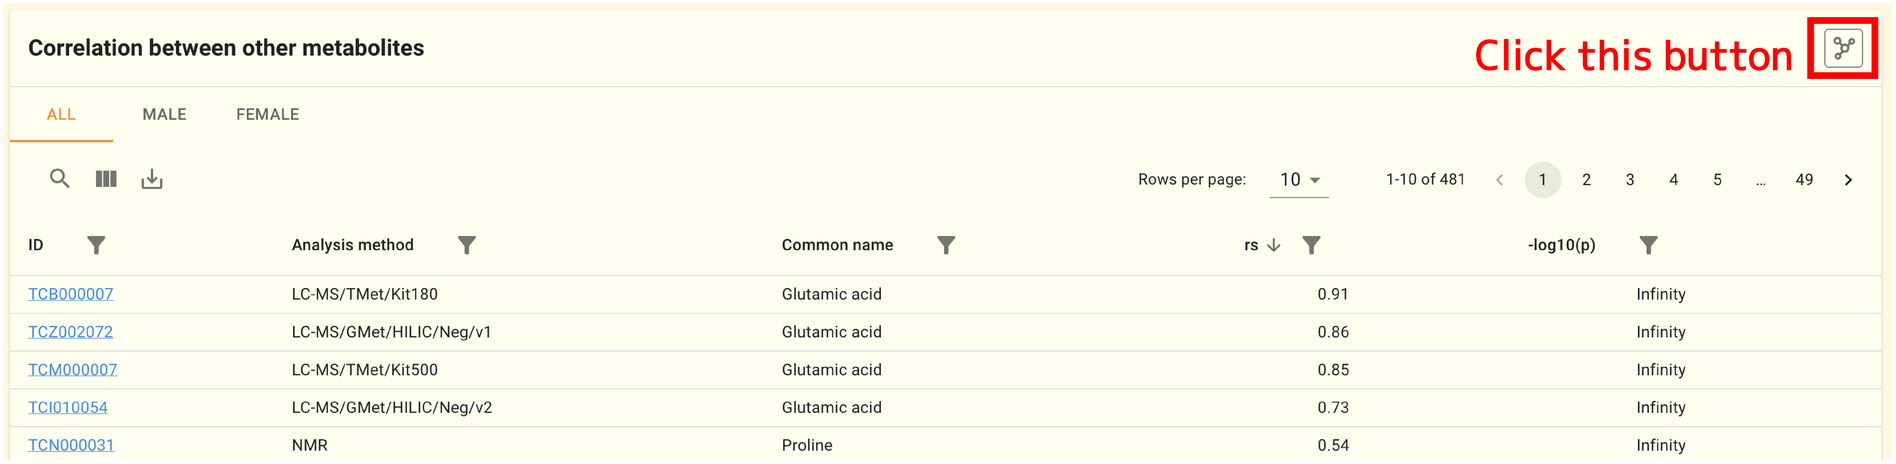
The Metabolite Correlation Network Viewer contains three panels: a network plot panel on the left that shows the network, and a network information panel on the upper right corner that controls how it is displayed, and a metabolite information panel on the lower right corner that shows metabolite information included in the network.
2.9.2. Network plot panel
This panel is located on the page’s left side. You can visually examine the relationships between the metabolites.
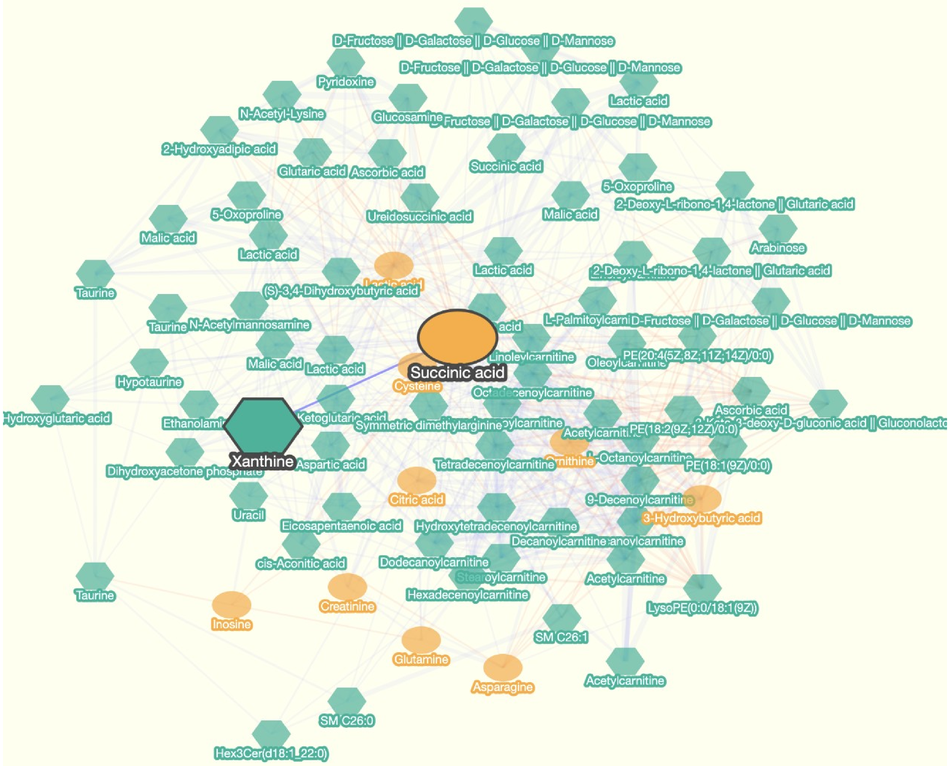
These operations can be performed on this panel:
Select Metabolites: Click on the node
Select correlation (edge): Click on an edge (example in the image)
Scaling: Scrolling (mouse wheel rotation)
Move metabolites: Drag a node
Move entire view: Drag outside of a node
Note
The network viewer displays nodes that are connected by at least one edge (degree of the node is equal or greater than 1). Hence, a graph with no edges will not be drawn.
2.9.3. Network information panel
This panel can be seen in the page’s upper right corner. There are three tabs: METABOLITES, EXPORT, and VIEW. Here, you can adjust the correlation network in a various ways.
2.9.3.1. Network operation
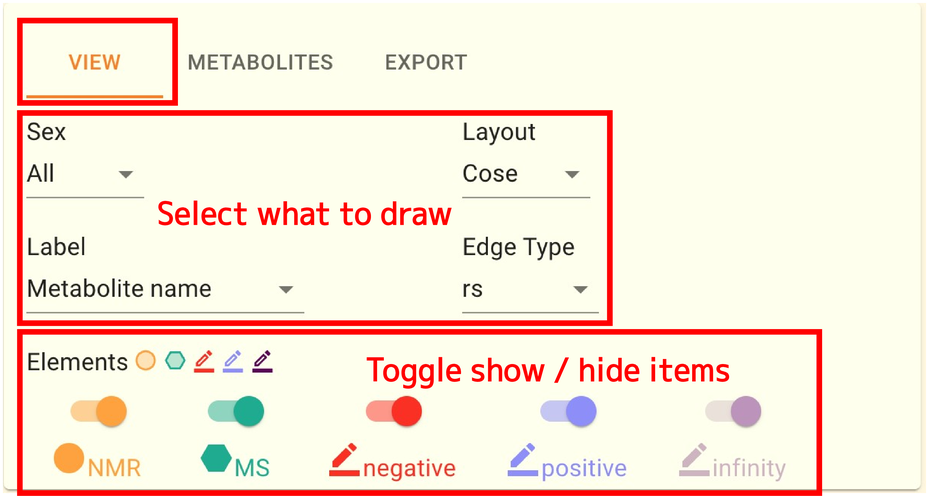
VIEW タブではネットワークとして可視化する情報を切り替えたり、ノードの配置を変更したりすることができます。 操作できるのは以下の5つです。
Sex: What to do with the gender condition
Layout: how to layout a network
Label: what to display as the label for each node
Edge Type: what value to use as the edge of the network
Elements: Toggle show/hide nodes and edges on the network
2.9.3.2. Metabolite search and display control
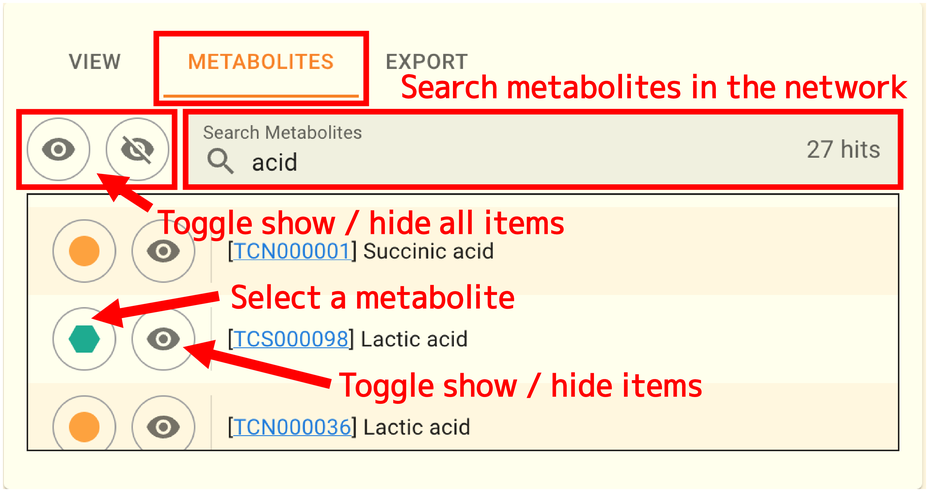
You can view a list of the metabolites that are currently visible in the network by selecting the METABOLITES tab. Additionally, you can search for metabolites in the network and change show/hide for each metabolite. An example of searching for acid is shown in the image above. The number of results is displayed to the right of the search box.
2.9.3.3. Download network data
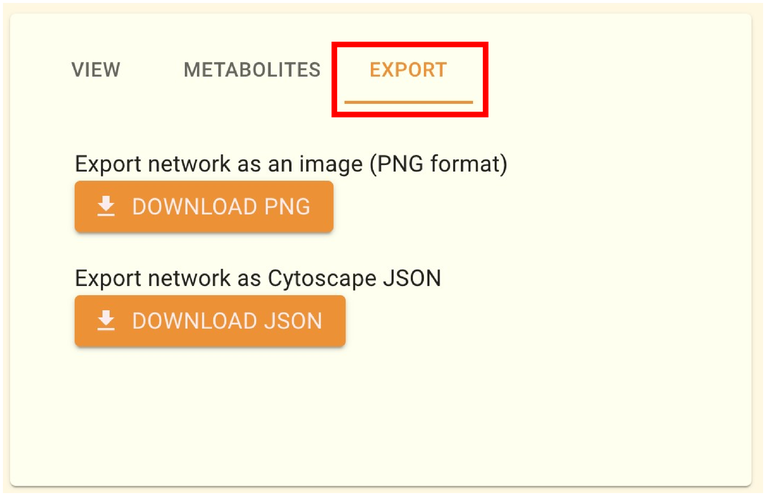
You can download network as a file using the “EXPORT” tab. The network structure data can be downloaded in JSON format, and the picture data can be downloaded in PNG format. The desktop version of Cytoscape can open files in JSON format.
2.9.4. Metabolite information panel
In the lower right panel, you can view more specific details about the network item you’ve chosen. Depending on the current selection (node or edge), the information shown in this panel will change.
2.9.4.1. Metabolite details
The panel will appear as follows when a metabolite (node) is selected.
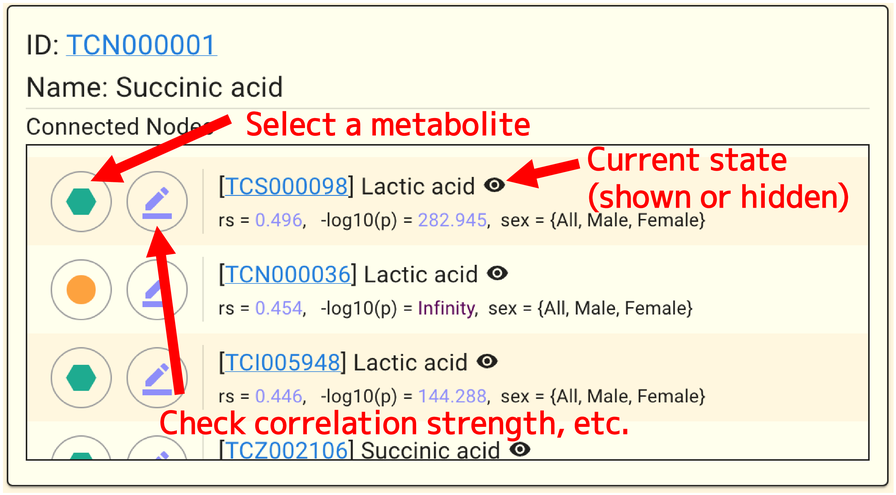
You can view the list of metabolites with correlation data for the selected metabolite under Connected Nodes. The list is sorted by the currently displayed EdgeType (rs or -log10(p)) value in descending order. Each item in the list has two buttons on the left side; the left button selects the metabolite, and the right button selects the connection. Additionally, some of them have a gray background, and pressing the button is disabled, indicating that no correlation data exist for the gender conditions that are currently being shown. It is noted in “ “ to the right of the metabolite name with which sex condition it is associated.
Note
jMorp only lists correlations where the absolute value of the Spearman correlation coefficient is greater than or equal to 0.2 and the p-value is less than 10^ -5. No correlation means the absence of any association that meets the criteria outlined above.
2.9.4.2. Details about correlation relationships
The panel will appear as follows when correlation (edges) are selected.
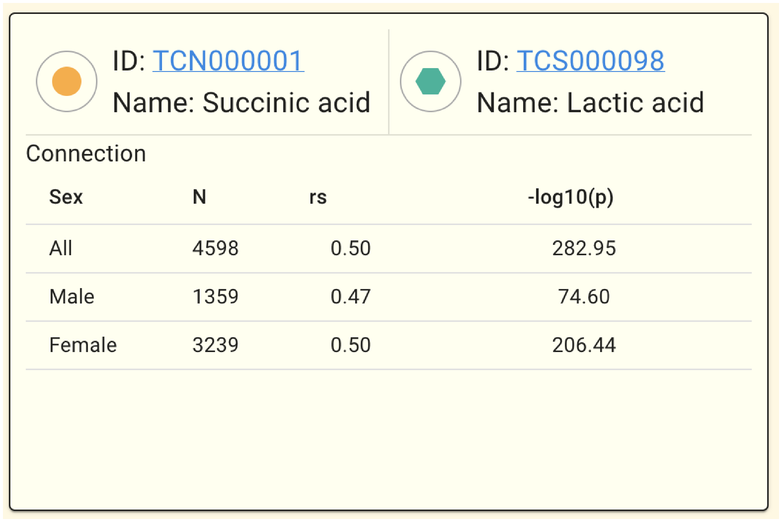
You can view the correlation between the two relevant metabolites in each gender condition using Connection.