2.8. Metabolite page
In jMorp, each metabolite has a page that includes information about its frequency distribution, changes by age and sex, correlation with other metabolites, and, for some metabolites, changes according to pregnancy status and changes in time. The relevant metabolite page will open when you enter a metabolite name or m/z (for metabolites analyzed by MS) into the search box on the top page of jMorp. To view a list of metabolites, select Metabolome 2023 from the menu on the right side of the jMorp home page.
The Glutamic acid’s metabolite page (https://jmorp.megabank.tohoku.ac.jp/metabolome/TCN000015) will be used as an example in the subsequent sections to describe the contents of each panel. For the metabolite dataset itself, see here.
2.8.1. Metabolite information panel
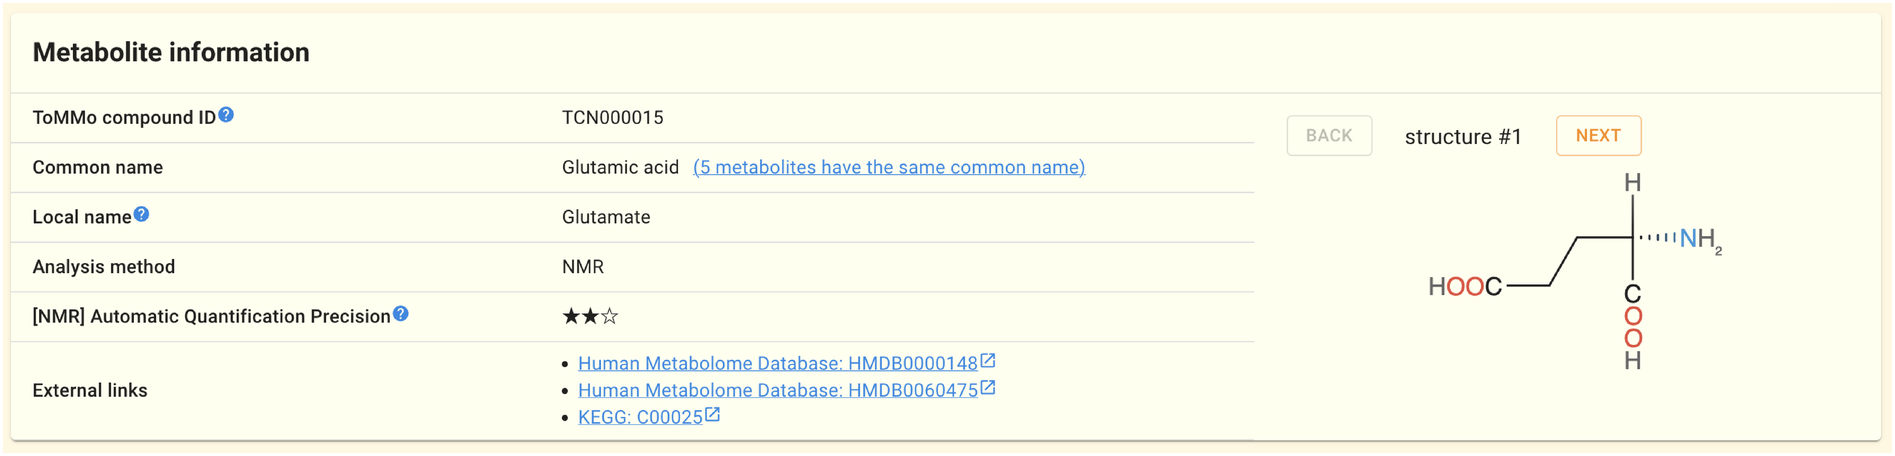
The metabolite’s ID, chemical structure, common name, local name (metabolite name in old jMorp), analysis platform and method, precision in automatic quantitation (only for NMR), m/z and retention time (only for MS global target analysis), and metabolite ID in other databases are displayed in this panel.
Note
This page contains details about metabolite IDs and the precision of NMR automatic quantification.
2.8.2. Concentration distribution panel
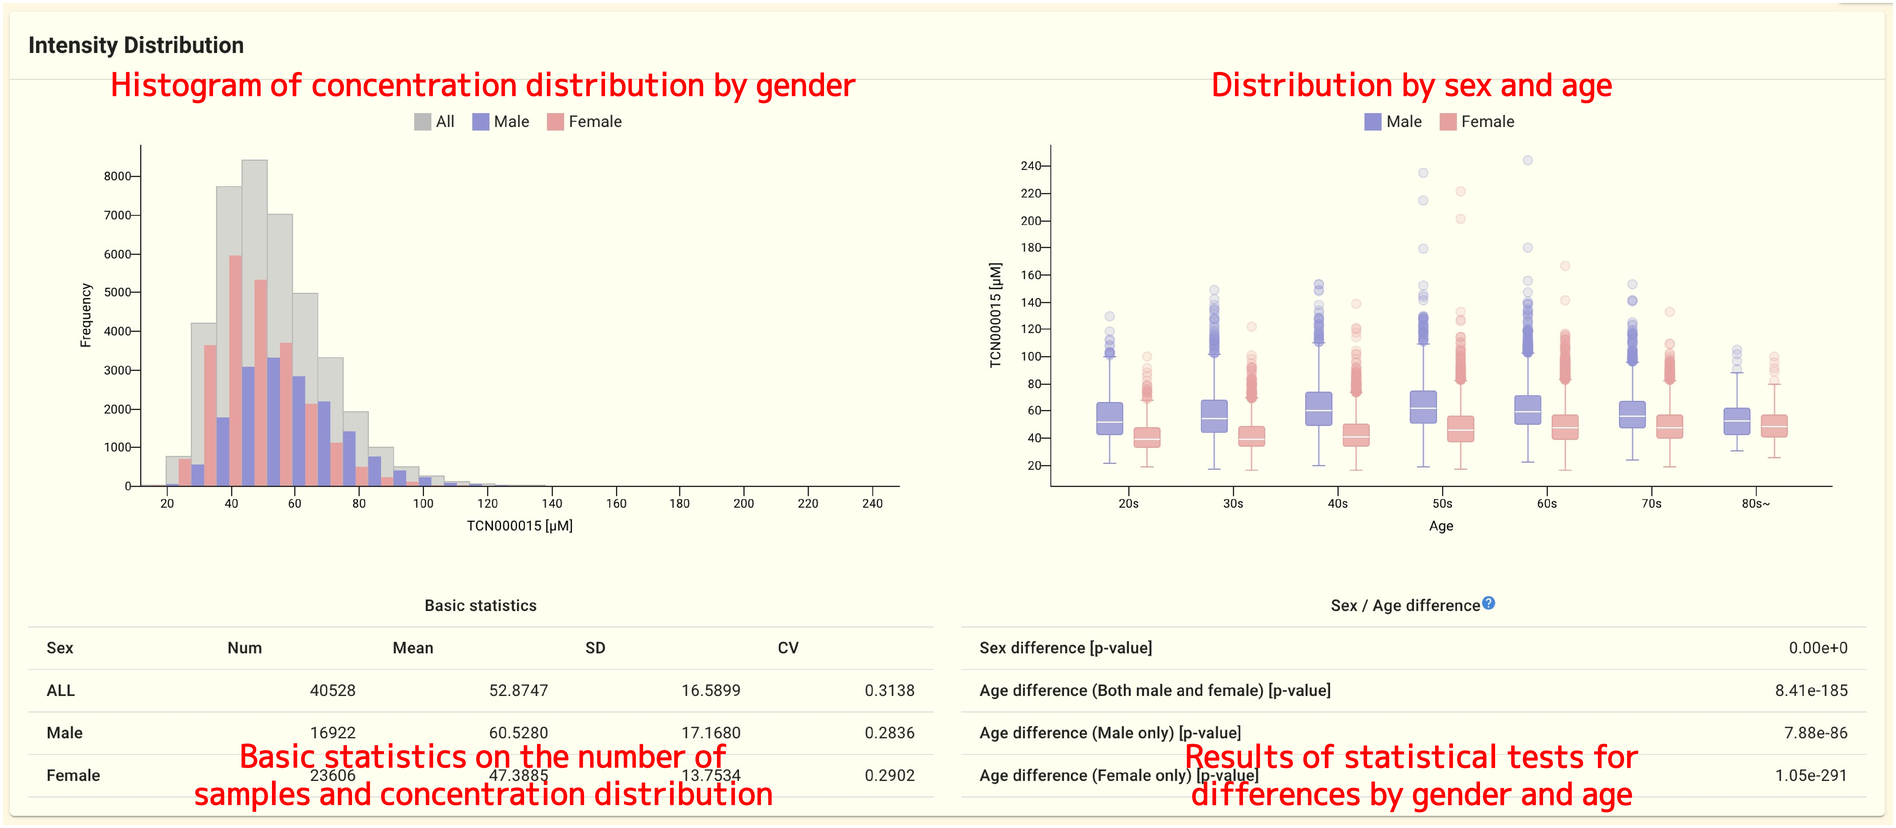
This panel shows the distribution of concentrations by gender and age group, as well as the results of statistical tests to determine whether there are differences in concentrations for different gender and age groups.
2.8.3. Postprandial changes panel
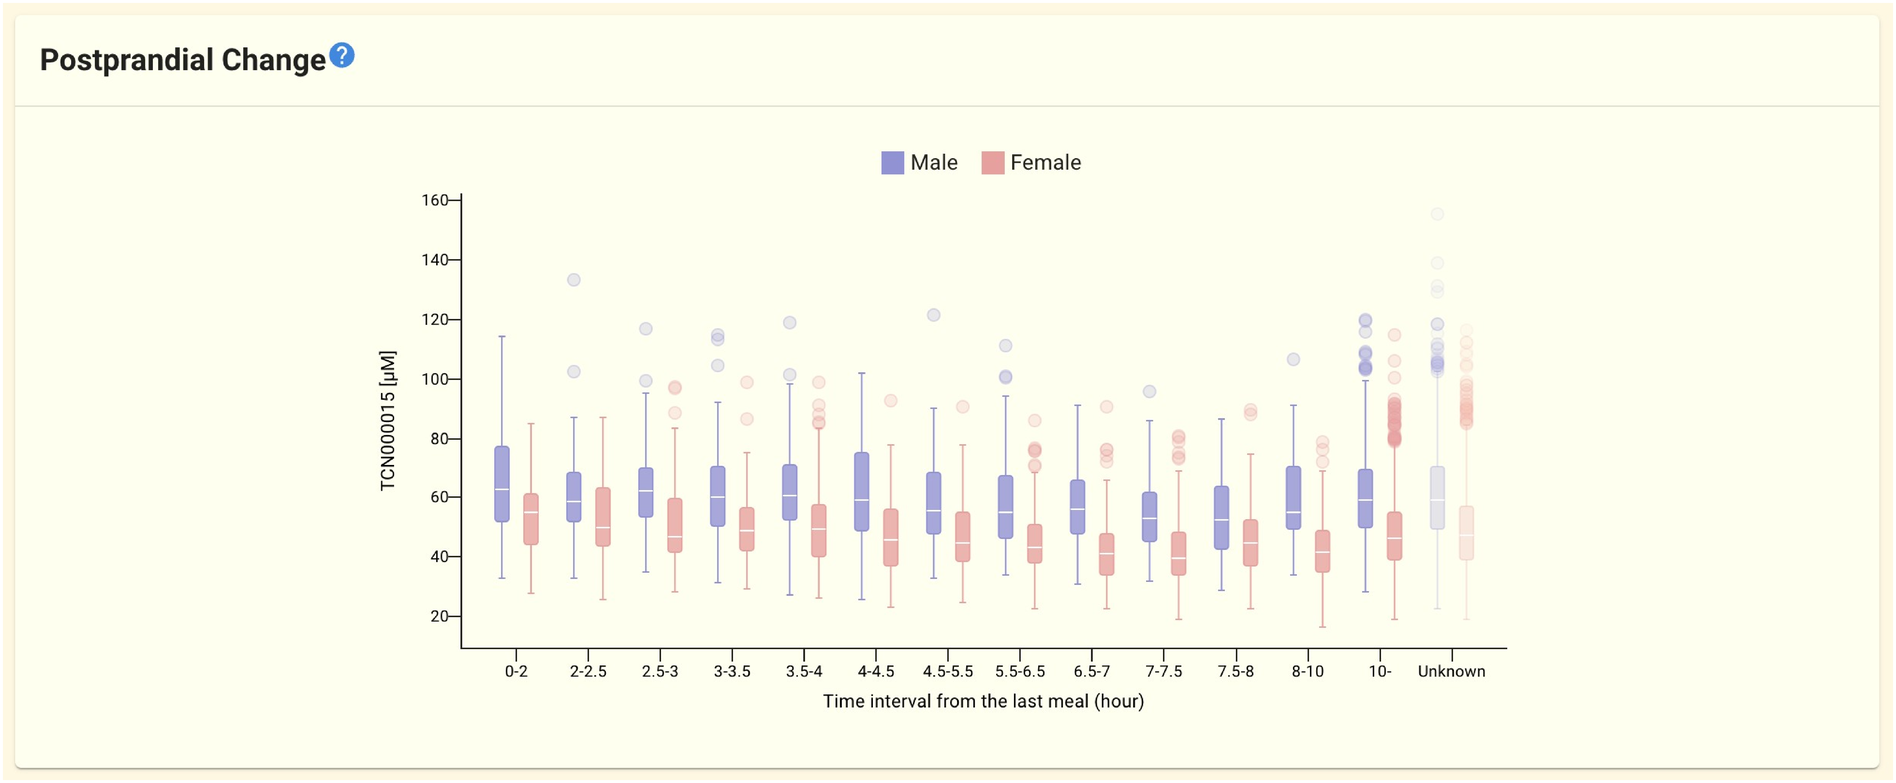
This panel displays differences in plasma metabolite concentrations over time after a meal.
2.8.4. Pregnant - non-pregnant comparison panel
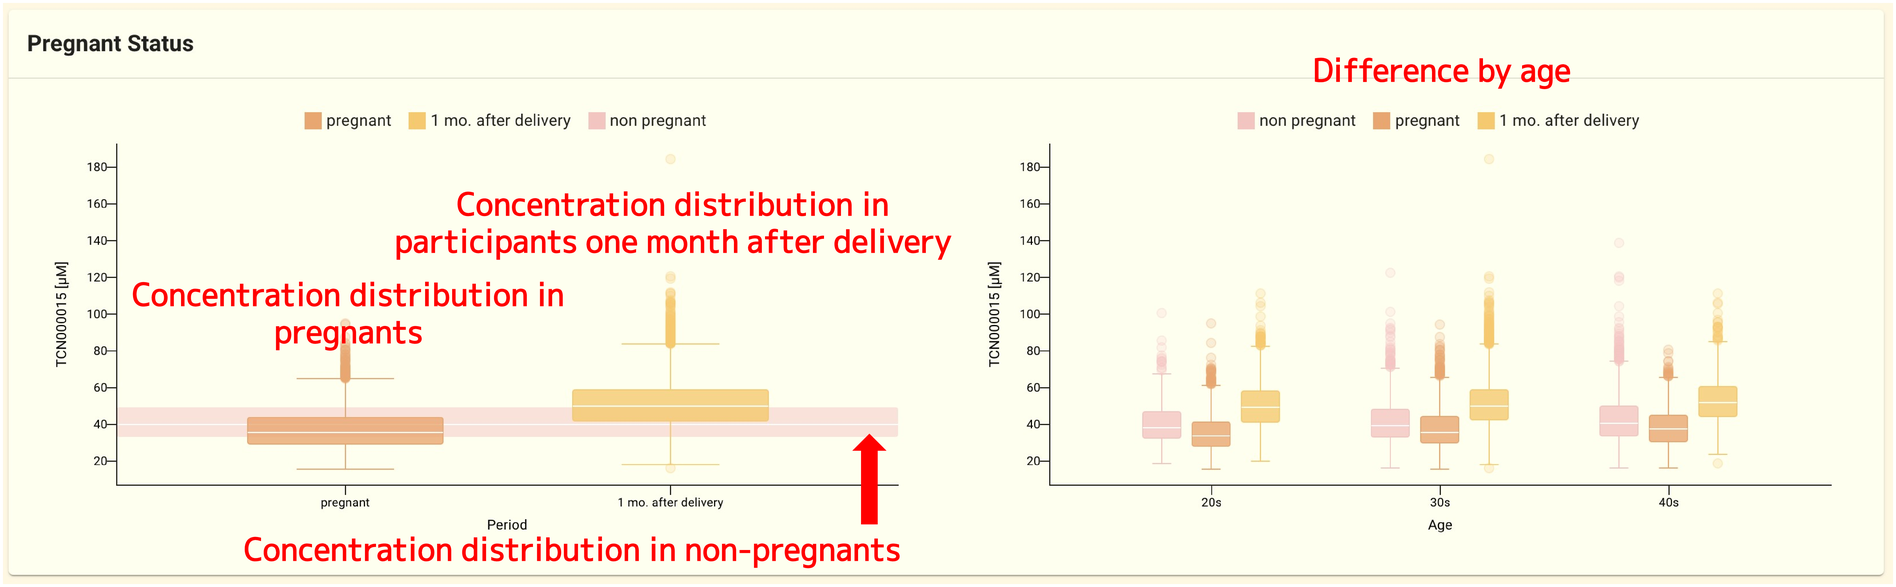
The distribution of concentrations in pregnant women, women a month after delivery, and non-pregnant women is shown in this panel.
2.8.5. Repeat assessment panel
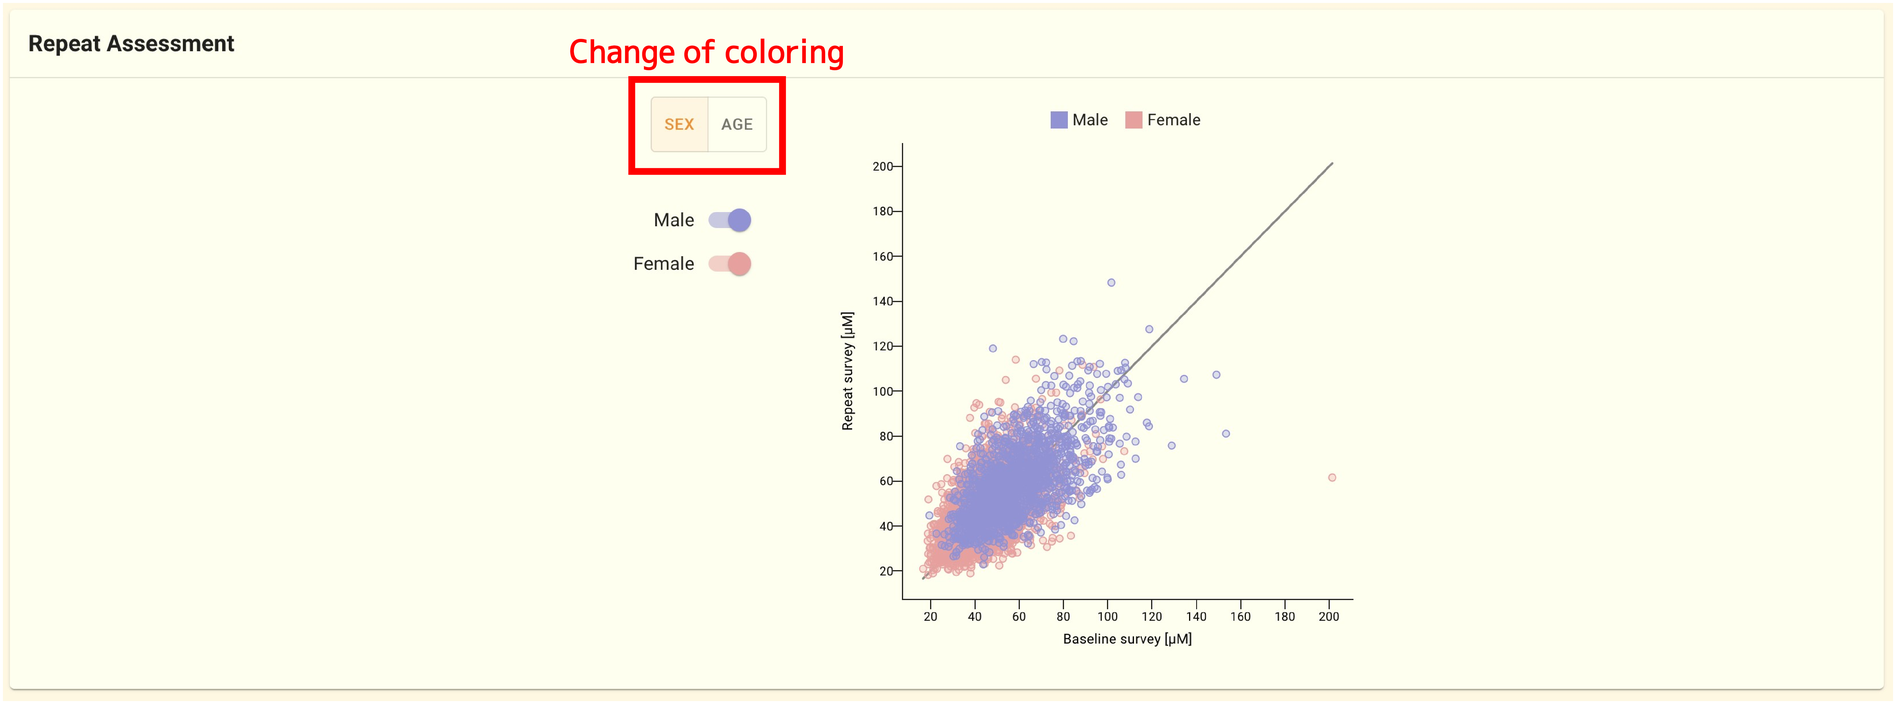
This panel shows the concentrations for metabolites for which blood was obtained in the cohort study twice, once on the horizontal axis and once on the vertical axis. The plot can be color-coded by sex, age group, and genotype for those reported to have differing concentrations due to genetic factors by selecting the box in the plot’s upper left corner.
2.8.6. Metabolite correlation panel
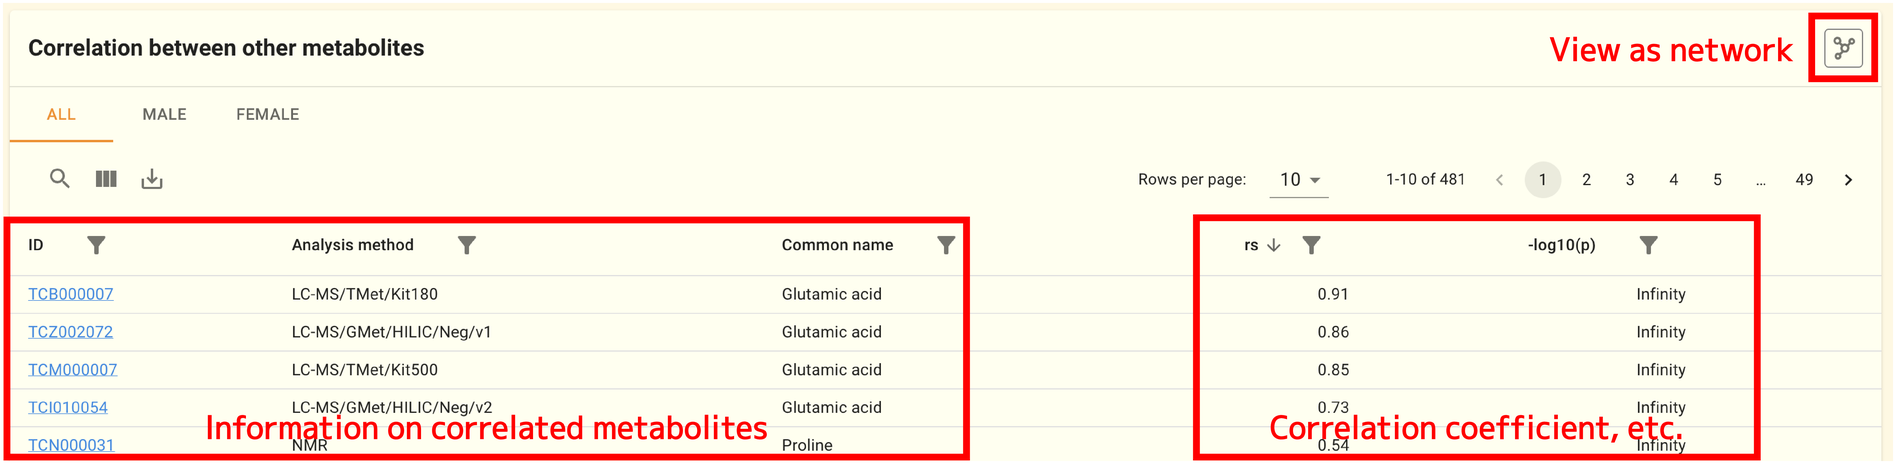
This panel displays correlations between metabolites within a metabolite dataset for the same person with analysis values for different analysis platforms and different metabolites.
To visualize the correlation shown in table format as a network, click the View as netwok button in the upper right corner. In the subsequent section,more details on how to use correlation networks are given.
Note
jMorp only provides correlations if the absolute value of the spearman correlation coefficient is greater than or equal to 0.2 and the p-value is less than or equal to 10-5.
2.8.7. GWAS panel
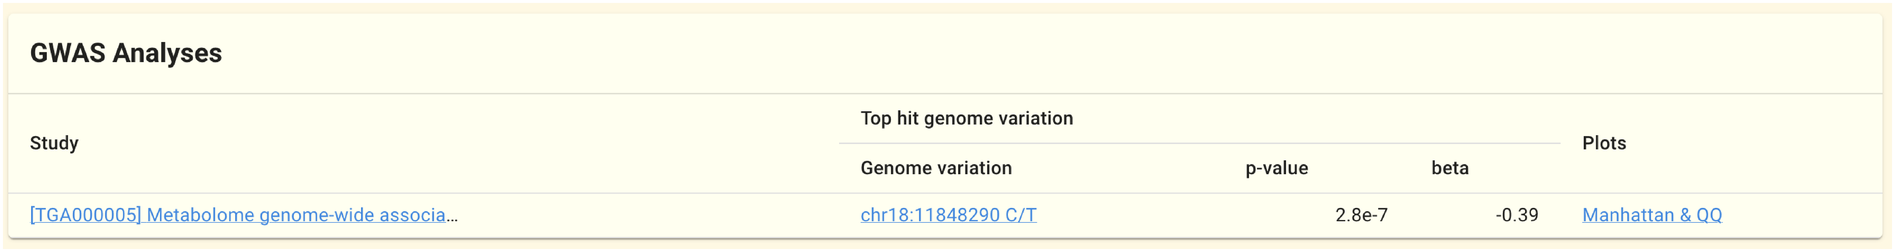
If any GWAS studies were conducted on the metabolite, information from those studies is shown in this panel.
2.8.8. Metabolic index panel
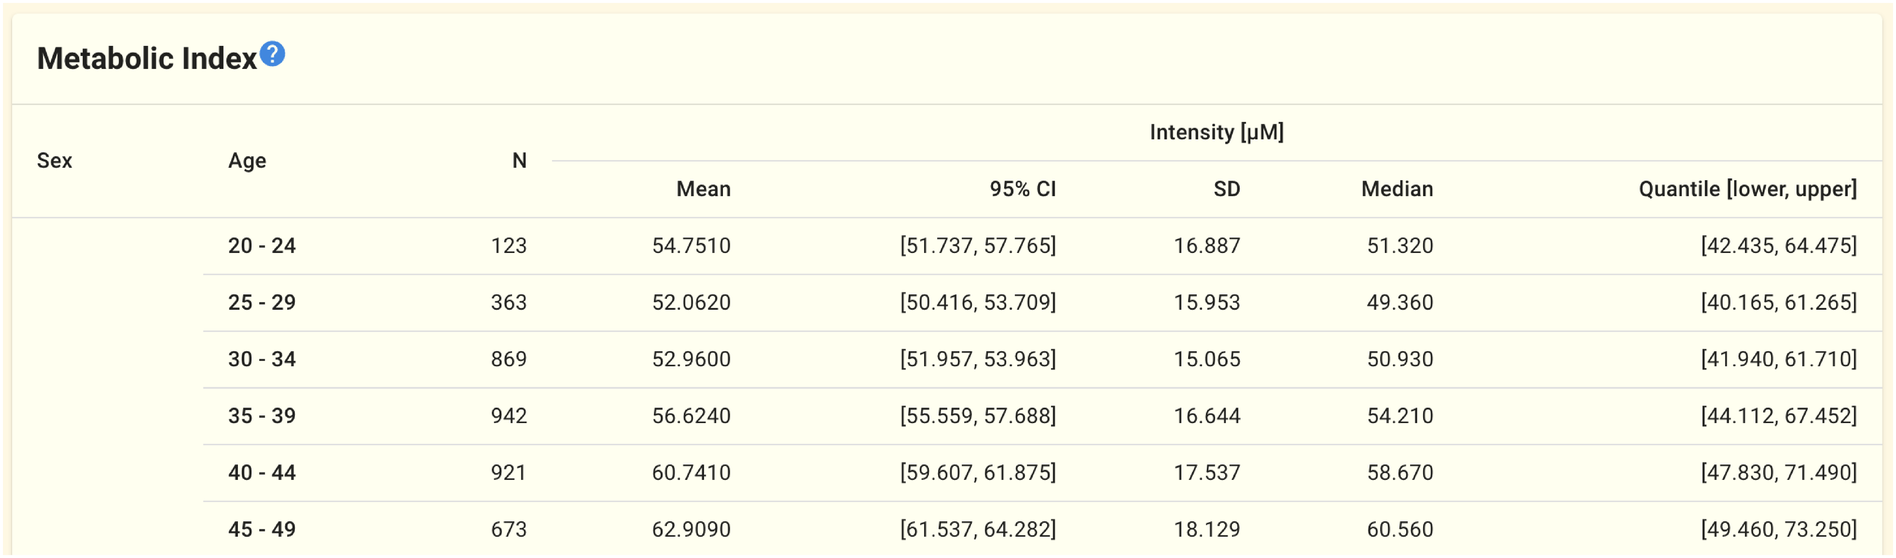
This panel displays indicators stratified by age and gender.