1.3. Website structure
The jMorp website is organized as follows:
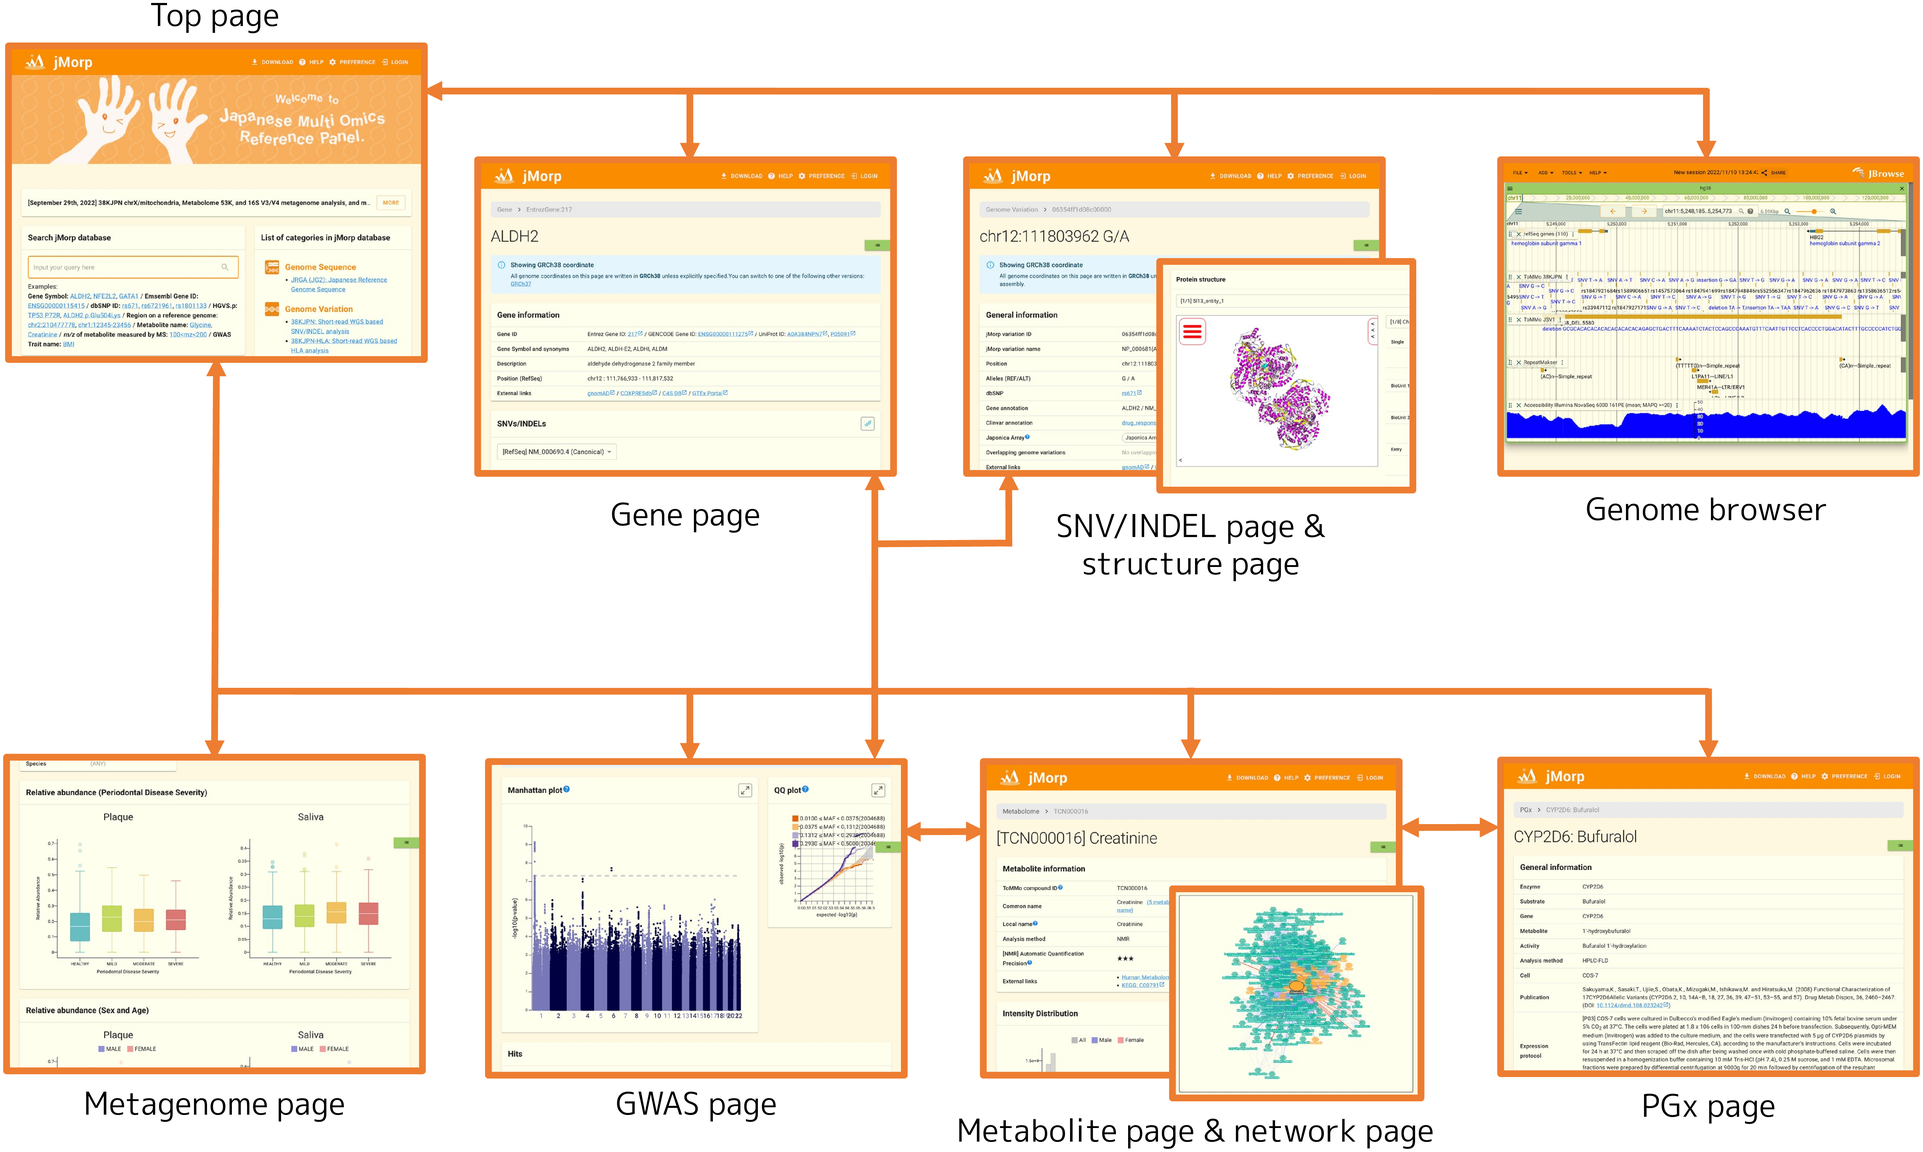
- Top page
Batch search of entries in jMorp
Index for categories
- Gene page
Gene ID & name
SNV/INDEL list & allele frequency information
Methylation Information
Gene expression information
Genome browser
GWAS analysis Information
- SNV/INDEL page
dbSNP and ClinVar annotations
Tiled on Japonica Arrays
Allele & genotype frequency
Gene annotation
GWAS analysis Information
LiftOver
- CNV page (not shown in the figure)
Frequency information of Copy Numbers
- STR page (not shown in the figure)
Minimum, mean, median, and maximum number of repeats
- SNV/INDEL structure mapping tool
Results of mapping SNV/INDEL to protein structure
- Genome browser
Genome sequence (JG2.1.0)
SNV/INDEL
SV
Methylation
Genome Accessibility
- Metabolite page
Compound names and links to external databases
Structure
[NMR] Automatic quantitation precision
[MS] m/z & retention time of metabolites and adduct ions
Intensity distribution (general population, repeat assessment, differences between pregnant and non-pregnant)
Correlation between compounds
GWAS analysis results
- Metabolite correlation network viewer
Visualize and explore correlations between compounds as a network (graph)
- GWAS page
Study summaries of GWAS analyses performed in TMM project
Download summary statistics files
Displays manhattan plot and QQ plot
- MRI page (not shown in the figure)
Volume information of each brain region based on MRI brain imaging
- PGx page
Genome variations on drug metabolism-related genes and metabolic activity analysis information
- Metagenome page
Relative abundance of microbes is displayed by various categories (sample type, severity of periodontal disease, etc.)
- Download page (not shown in the figure)
Bulk download of jMorp datasets
- Whole genome sample repository (not shown in the figure)
A page presenting the short-read WGS analysis’s quality data (bases/average depth of each sample in the 50KJPN repository), as well as the accessibility of SNP arrays and metabolome data
- Code repository (not shown in the figure)
Repository of software developed in TMM
To learn how to use each page, please refer to How to use jMorp website.