2.2. SNV/INDEL page
Information regarding SNVs and INDELs in the TMM whole genome panel, including 38KJPN, is shown on the SNV/INDEL page.
The SNV/INDEL page will appear when you perform a search on the jMorp top page by using dbSNP ID (rsID), HGVS.p, etc. The following panel can be found on the SNV/INDEL page.
Basic information panel (ID, genome coordinates, coordinates, annotation, etc.)
Allele / genotype frequency panel
Gene annotation panel
dbNSFP score panel
GWAS analysis results panel
LiftOver panel
The SNV/INDEL page of rs671 (https://jmorp.megabank.tohoku.ac.jp/genome-variations/sr-snvindel/06354ff1d08c00000) will be used to describe the contents of each panel in the following sections.
2.2.1. Basic information panel
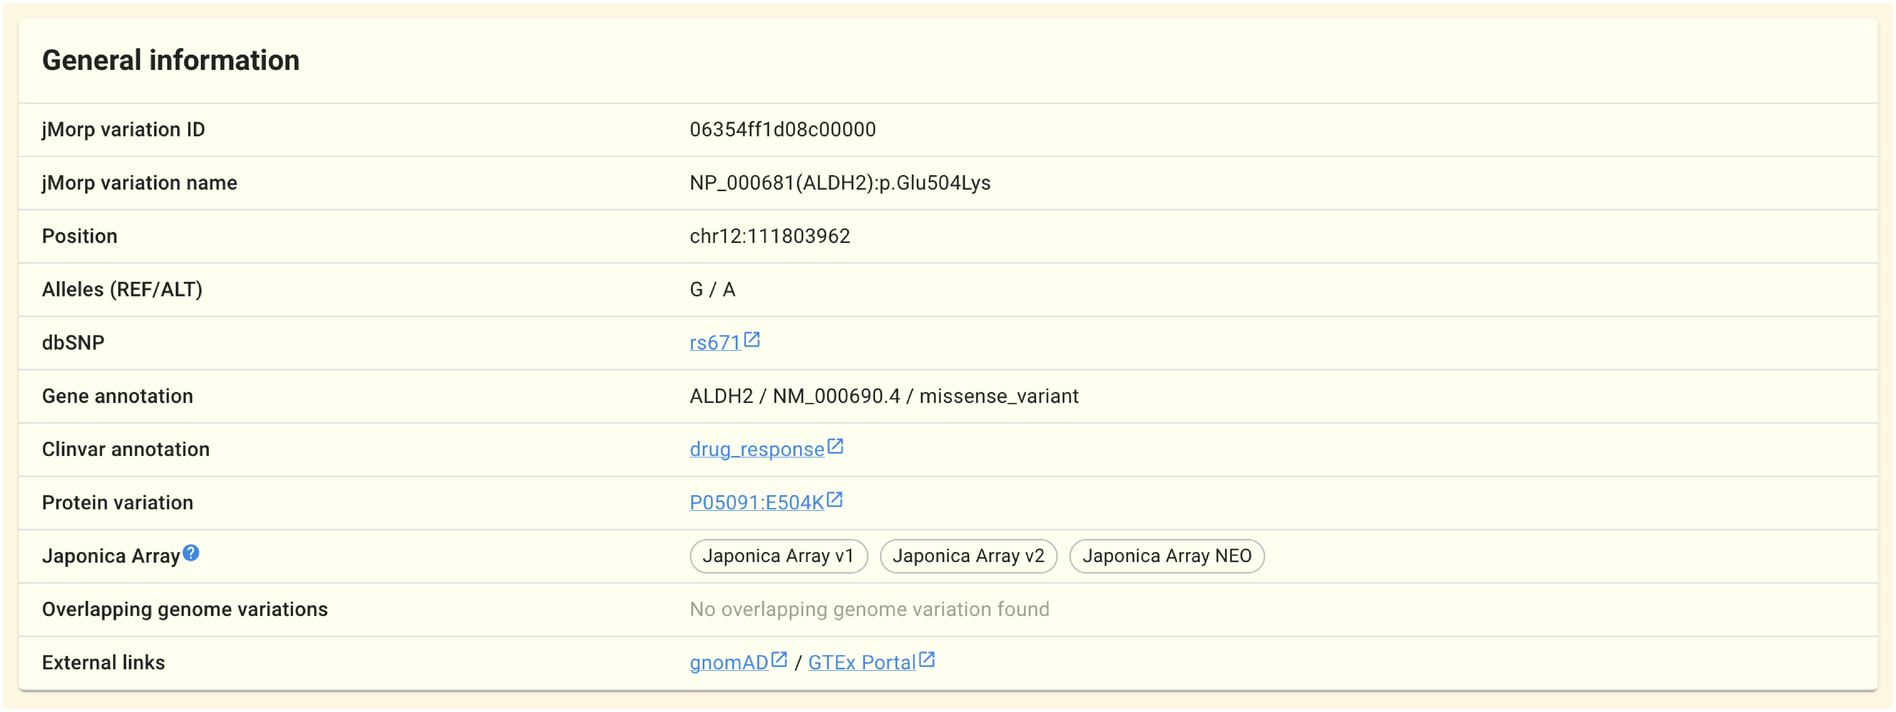
The jMorp variation ID/name (ID/name of SNV/INDEL on jMorp), position on a reference genome, alleles, dbSNP IDs, gene annotations, ClinVar annotations, Japonica Array tiling status, and genome variations that overlap with this genome variation are shown in this panel.
Tip
To distinguish SNVs and INDELs, jMorp uses the jMorp variation ID and jMorp variation name. Each SNV/INDEL (for each pair of chromosome, position, reference allele, and alternative allele) is assigned one. The jMorp variation ID is based on VariantKey, and the jMorp variation name is based on the RefSeq canonical transcripts.
2.2.2. Allele / genotype frequency panel
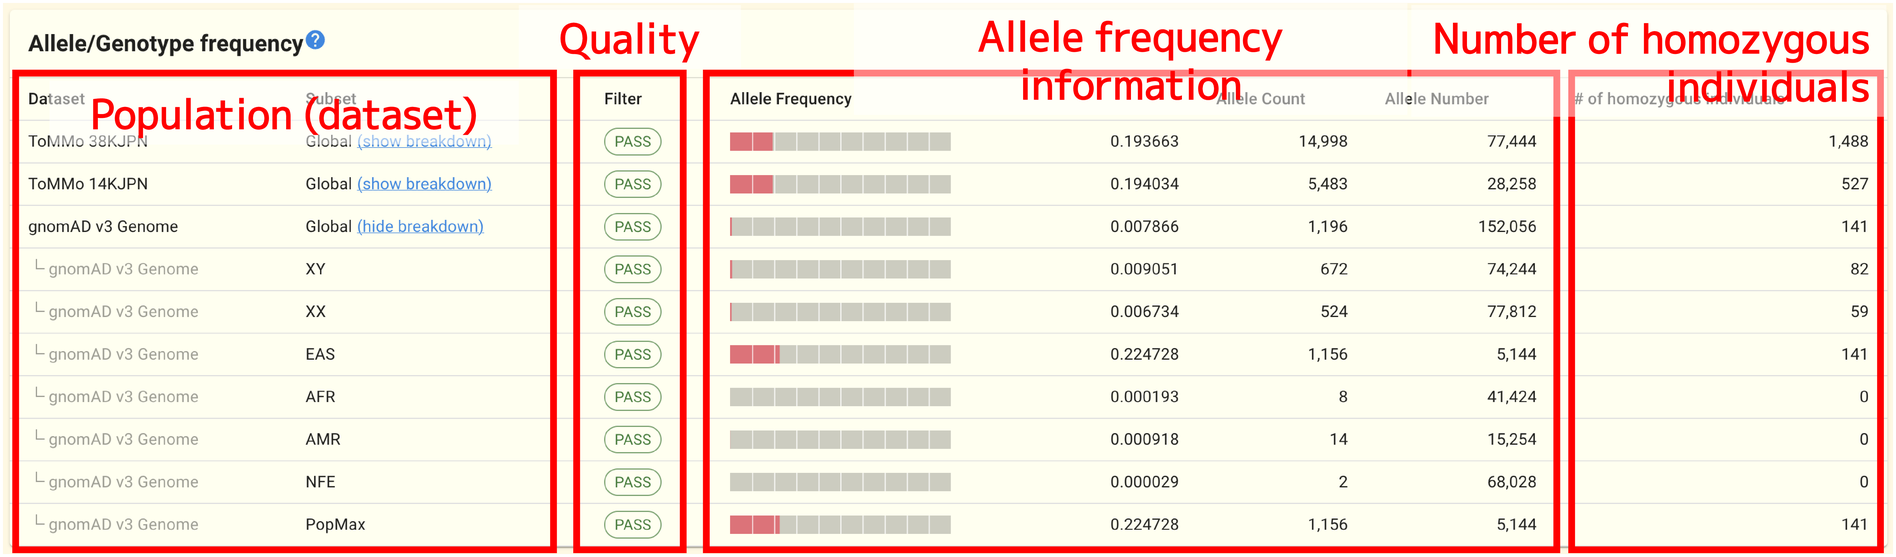
This panel shows the allele frequencies of variations derived from the results of the TMM whole genome analyses (54KJPN, 38KJPN, 14KJPN, 8.3KJPN, 4.7KJPN, and 3.5KJPNv2). The allele frequency information from the gnomAD database, run by the Broad Institute of the United States, is also displayed for comparison. It contains data on allele frequencies for several ethnic groups in the world. One line represents one population, and it contains information about the variation’s quality (the filter column; PASS for good quality, FAILED for low quality), as well as information about the allele frequency (count, number, and ratio) and number of homozygous individuals.
By clicking show breakdown, you can also see the more detailed frequency data (TMM data: broken down by gender, analysis platform (sequencer), gnomAD data: ethnicity). Names of genders, and ethnic groups are shortened as follows.
Abbreviation |
Meaning |
|---|---|
XY |
Male |
XX |
Female |
EAS |
East Asian |
AFR |
African |
AMR |
Admixed American |
NFE |
Non-Finnish European |
PopMax |
Population Max (frequency is calculated for each ethnic group and the maximum value is displayed) |
Variant quality information can be found in the Filter column. In case of TMM whole genome panel, VQSR filtering method is used to assess the quality of each SNV/INDEL. For more information on the filtering method, see https://gatk.broadinstitute.org/hc/en-us/articles/360035531612 and DePristo et al. [14]. The gnomAD datasets use a different filtering strategy. For more information about gnomAD datasets, see Karczewski et al. [15].
2.2.3. Gene annotation panel
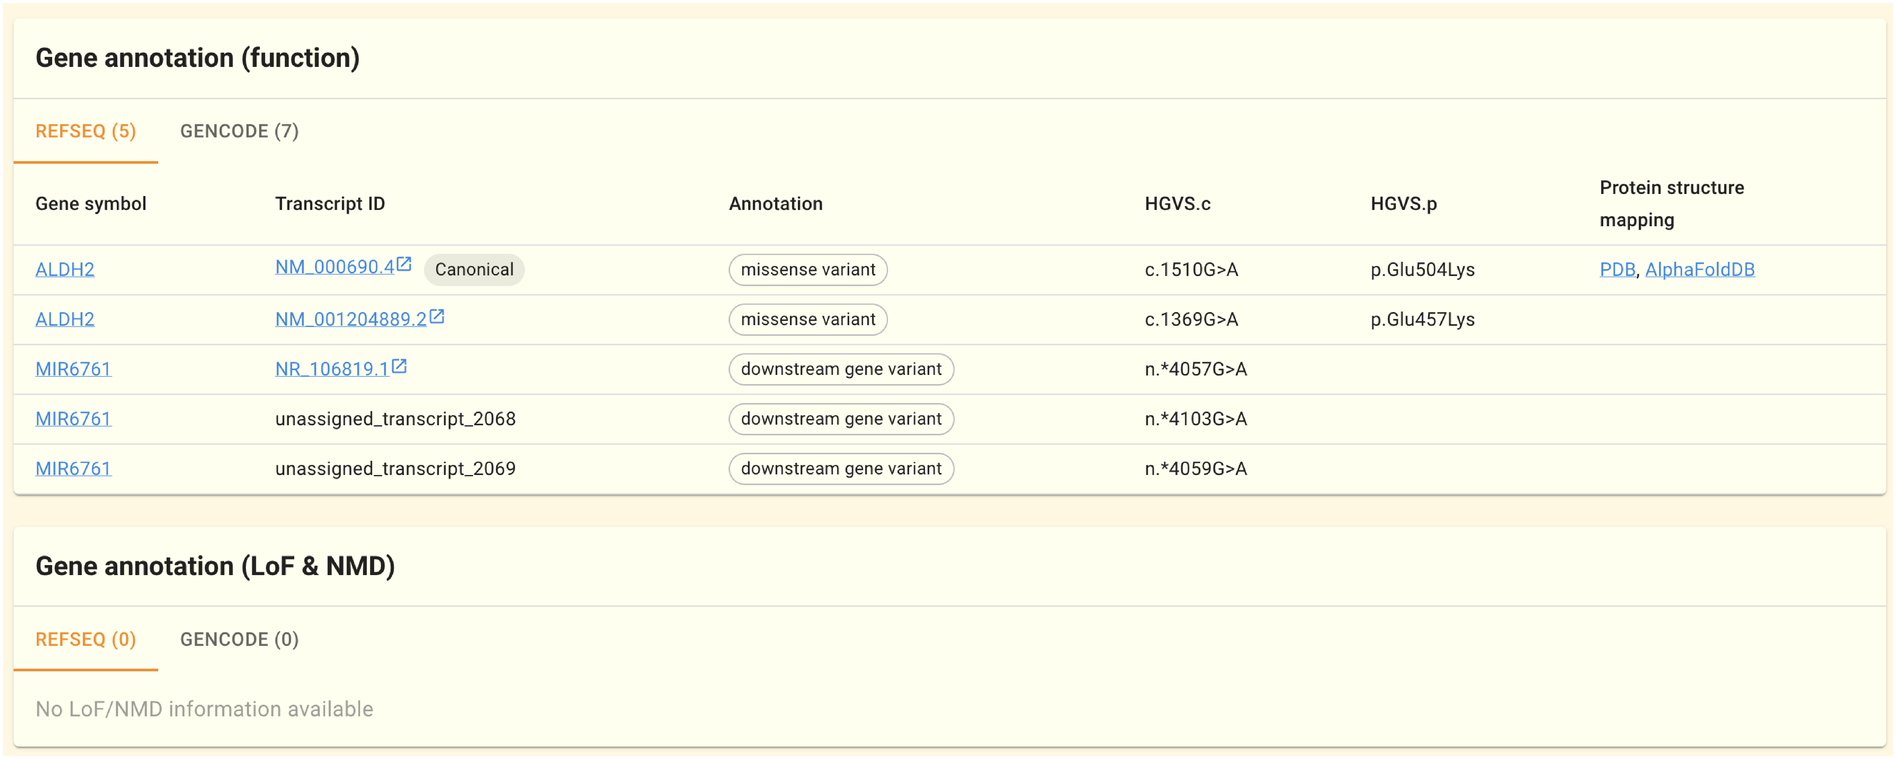
The gene annotation (function) panel shows gene annotations by mapping genome variations to transcript sequences. The annotations make use of the gene models provided by GENCODE and RefSeq. The annotations were done with SnpEff. One line is provided for each transcript sequence, along with the gene symbol, transcript sequence ID, annotation, HGVS.c, and HGVS.p. The “Protein structure mapping” column on the left side of the table shows the result of mapping this variation to the protein structure. Details are provided on the SNV/INDEL Protein Structure Mapping Tool page.
In the Gene annotation (LoF & NMD) panel, SnpEff’s predictions for LoF (Loss of Function) and NMD (nonsense-mediated decay) are shown, if any.
2.2.4. dbNSFP score panel
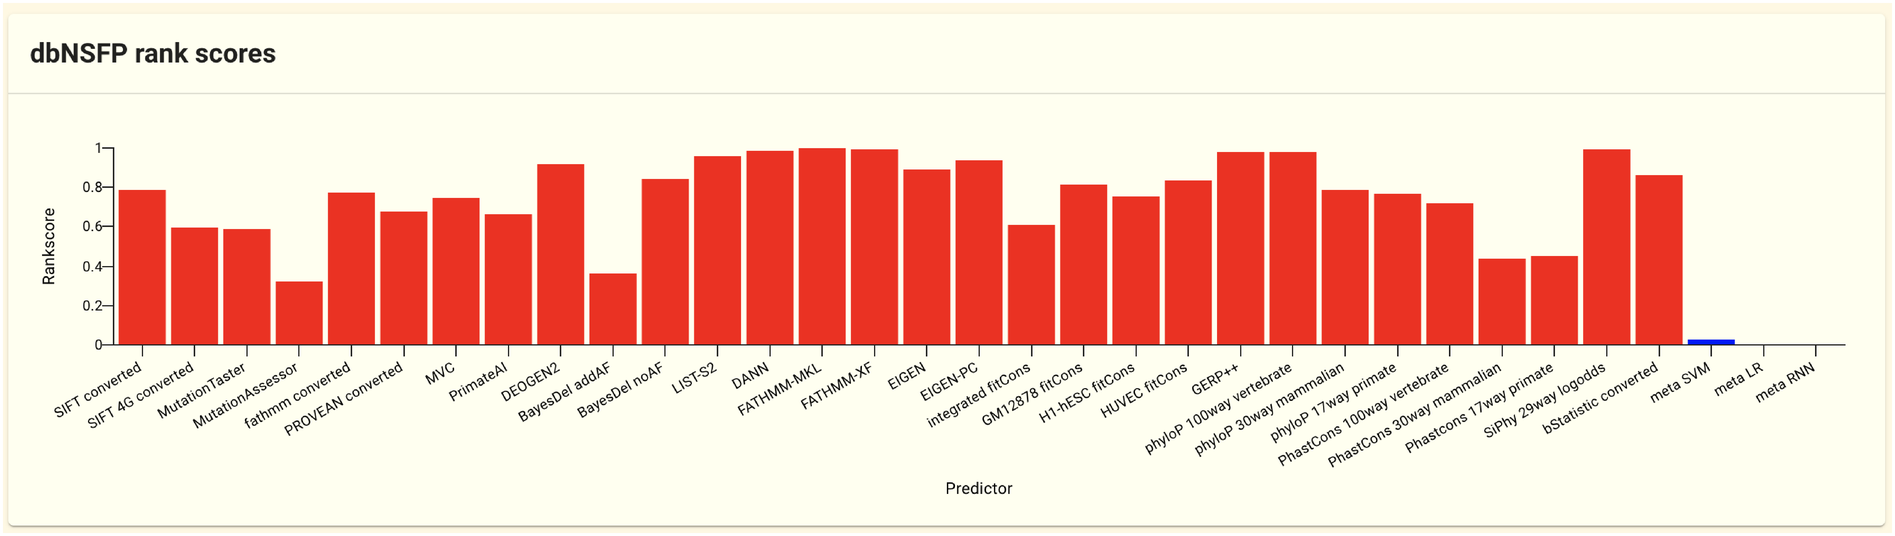
dbNSFP is a database that summarizes the scores of non-synonymous SNVs by running various function prediction tools. In jMorp’s dbNSFP score panel, the Rankscore (the function score output by each prediction tool is normalized from 0 to 1, and the higher value indicates harmful variation) is shown among the scores recorded in dbNSFP.
Red and blue bars can be found on the plot. The red bar shows the Rankscore for each function prediction tool, whereas the blue bar summarizes the Rankscore outputs of the individual tools. See the dbNSFP Web site and the article (Liu et al. [16], Liu et al. [17], Dong et al. [18]) for more details.
2.2.5. GWAS analysis results panel
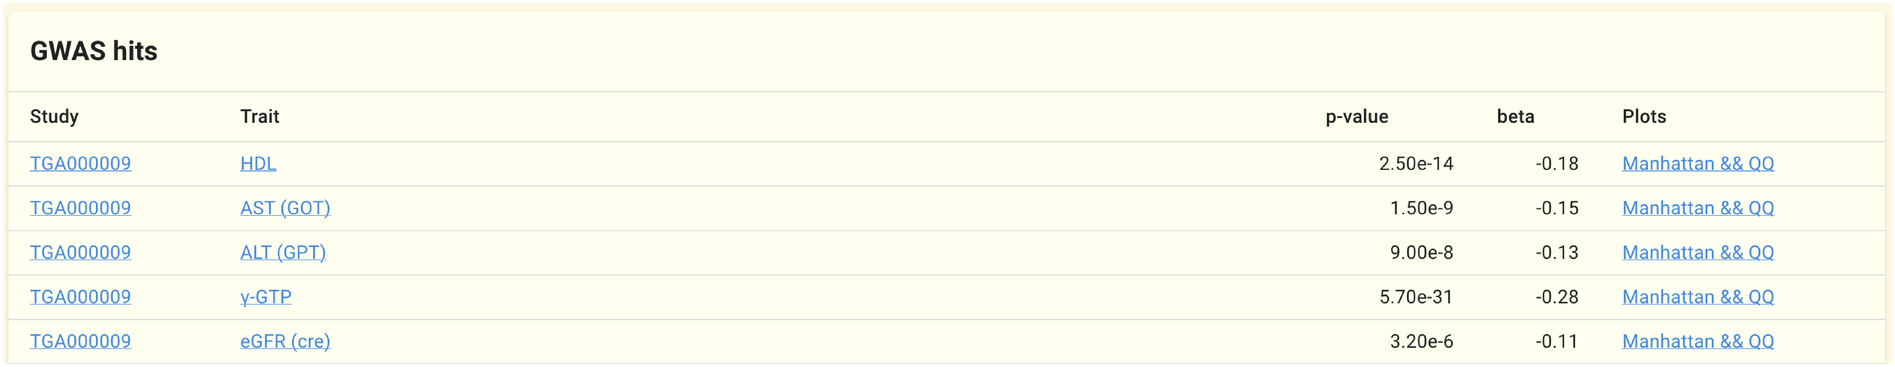
jMorp includes a repository of GWAS analysis results (summary statistics files) performed within the TMM project. In this panel, the results of the GWAS analyses that identified this genome variation as significant are extracted from the GWAS analysis repository, and the trait name, p-value, and beta value are displayed. The Manhattan && QQ link allows you to view the results of the GWAS analyses (Manhattan and QQ plots).
2.2.6. LiftOver panel
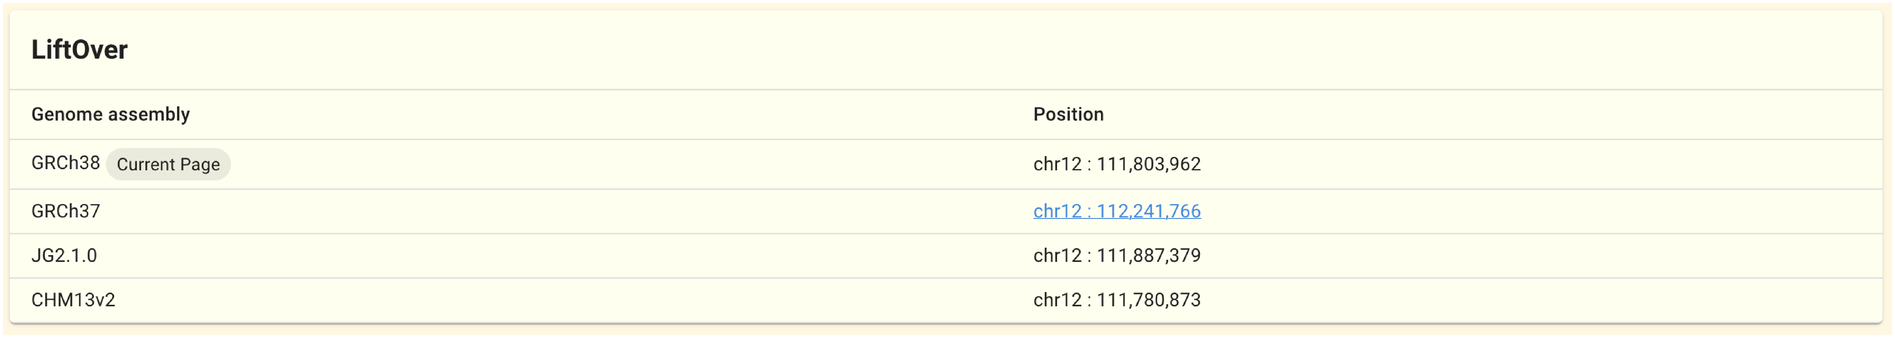
This panel displays the LiftOver results (coordinates in different genome sequences). Currently, the results of conversion to GRCh37, GRCh38, JG2.1.0, and CHM13v2 are available. The transanno is used for the LiftOver process.