2.1. Gene page
jMorp provides a page for each gene where you can collectively view various layers of data, such as SNV/INDEL information, gene expression information, and GWAS analysis result information on that gene. When you use the search box on the top page to look up a gene symbol or gene ID, the gene page comes up.
A gene page displays the following panels:
Gene information panel
SNV/INDEL panel
SNV/INDEL density panel
CNV panel
Methylation information panel
Gene expression panel
Genome browser panel
GWAS analysis results panel
HLA allele frequency panel (HLA genes only)
PGx panel (drug metabolism-related genes only)
The ALDH2 gene page (https://jmorp.megabank.tohoku.ac.jp/genes/217) is used as an example in the subsequent sections to explain each panel’s contents.
2.1.1. Gene information panel
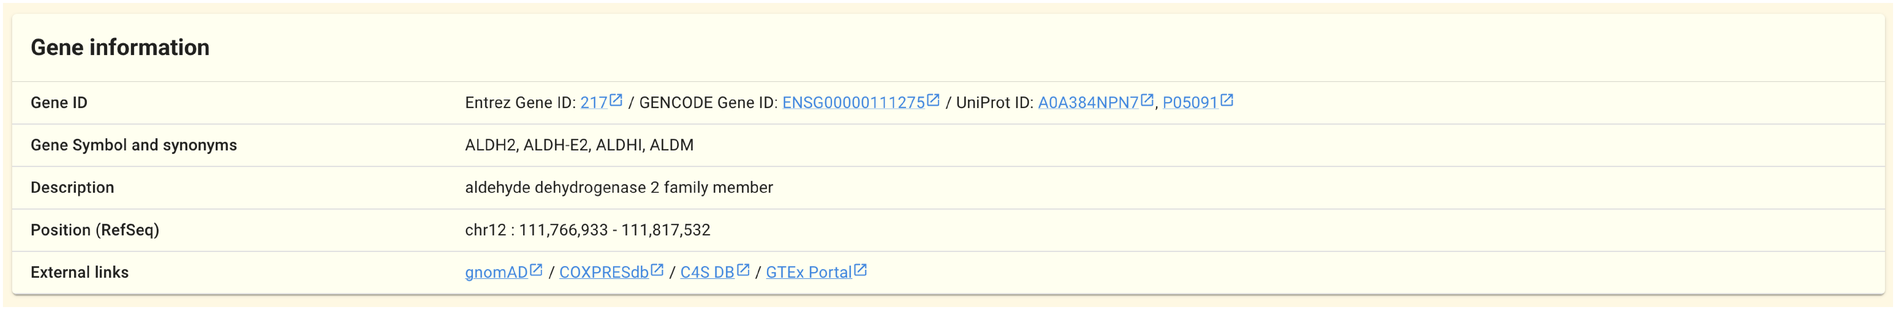
Basic information about the gene, including gene IDs, symbols, and location on a reference genome, is shown in this panel. The majority of the data shown in this panel is based on data from the public databases listed on this page.
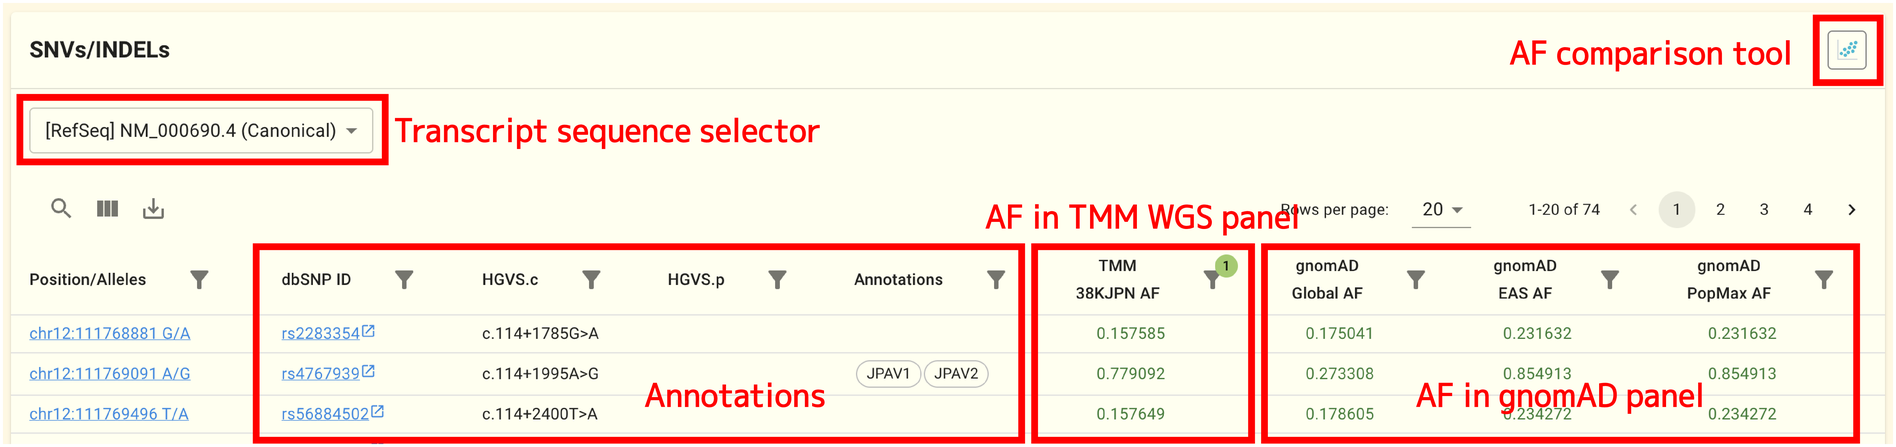
2.1.2. SNV/INDEL panel
SNVs and INDELs found on this gene by short-read whole genome sequencing carried out in the TMM project are shown in this panel. Each SNV/INDEL corresponds to a single row.
At the time of writing, the following datasets’ allele frequency data is displayed:
GRCh37: 8.3KJPN, 4.7KJPN, 3.5KJPNv2, gnomAD v2 Genome & Exome
GRCh38: 54KJPN, 38KJPN, 14KJPN, gnomAD v3 Genome
Note
The source of the allele frequency information shown in the SNV/INDEL panel will differ based on the reference genome you choose. Follow the instructions in the notice that is displayed at the top of the gene page to change the reference genome.

You can view more detailed information on the SNV/INDEL page by clicking on a Position/Alleles or similar column in the table.
The allele frequency comparison tool will open when you click the icon in the SNV/INDEL panel’s upper right corner. You can use this tool to compare allele frequencies for various populations graphically. This page contains comprehensive instructions on how to use the tool.
Clicking on a three-square icon at the top of the table will display additional information such as HGVS.c and HGVS.p. See also Tips: How to Use DataTable for more information.
The following columns are present in the table.
Column name |
Contents |
|---|---|
jMorp Variation ID |
ID to identify SNV/INDEL (assigned by jMorp) |
jMorp Variation name |
Name of SNV/INDEL (assinged by jMorp) |
Position/Alleles |
Position on the reference genome and reference/alternative alleles |
dbSNP ID |
IDs in the dbSNP database maintained by the NCBI |
HGVS.c |
Variant notation in cDNA sequences |
HGVS.p |
Variant notation in amino acid sequence |
Annotations |
Display Gene annotation, ClinVar annotation, and JPA in one cell |
Gene annotation |
Gene annotation |
ClinVar annotation |
ClinVar annotation |
JPA |
Tiled on Japonica Arrays? |
TMM xxKJPN AF |
Allele frequencies in TMM whole genome panels (38KJPN etc.) |
TMM xxKJPN filter pass |
Whether this SNV/INDEL passes the quality filter in the TMM whole genome panel |
gnomAD Global AF |
Allele frequency in gnomAD dataset |
gnomAD EAS AF |
Allele frequencies in gnomAD EAS dataset (includes only East Asian individuals) |
gnomAD PopMax AF |
Allele frequencies in gnomAD PopMax dataset (Allele frequency information for the population with the highest frequency) |
gnomAD filter pass |
Whether this SNV/INDEL passes the quality filter in gnomAD dataset |
If the genome variation - protein structure mapping data are available, a link will also appear in the HGVS.p column. The protein structure viewer will open when you click the link. For more details on the protein structure viewer, refer to this page.
The selection of transcript sequence affects the HGVS.c and HGVS.p notations for a genomic variation. In the initial state, the RefSeq canonical transcript-based HGVS.c and HGVS.p are shown. Using the selector at the top of the table, you can alter the transcript sequences for resolving HGVS.c and HGVS.p.
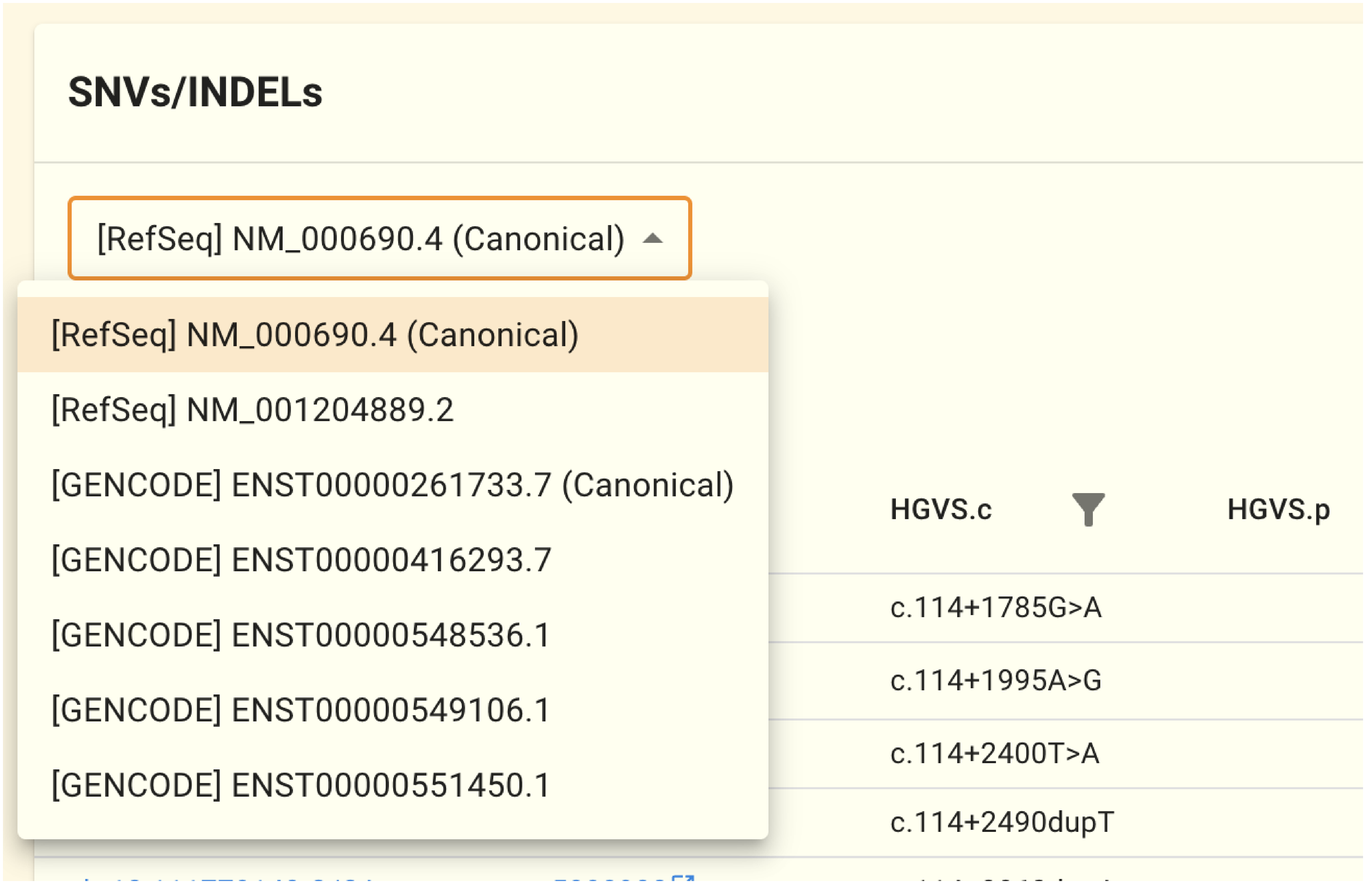
For example, ALDH2 has the following six sequences: NM_000106.6, NM_001025161.3, ENST00000359033.4, ENST00000360124.9, ENST00000488442.1, and ENST00000645361.2. NM 000106.6 is chosen in the initial state. The HGVS.c and HGVS.p in the table can be changed to the desired transcript sequence by modifying the selection in this selector.
Note
By default, annotations based on RefSeq canonical transcripts are shown; however, you can modify the default display to show annotations based on GENCODE canonical transcripts if you prefer GENCODE to RefSeq. To learn more, see the Preferences page .
Warning
The values in the HGVS.c and HGVS.p columns are altered by this selector, but the value in the jMorp Variation name column remains based on the RefSeq canonical transcript. As a result, there can be a difference between them.
The allele frequency values on the SNV/INDEL panel are written in green or orange, and the quality of each SNV/INDEL (filtering result) is represented by colors. Allele frequency values of high-quality SNVs and INDELs are denoted by green, whereas allele frequency values of low-quality SNVs and INDELs are shown by orange.
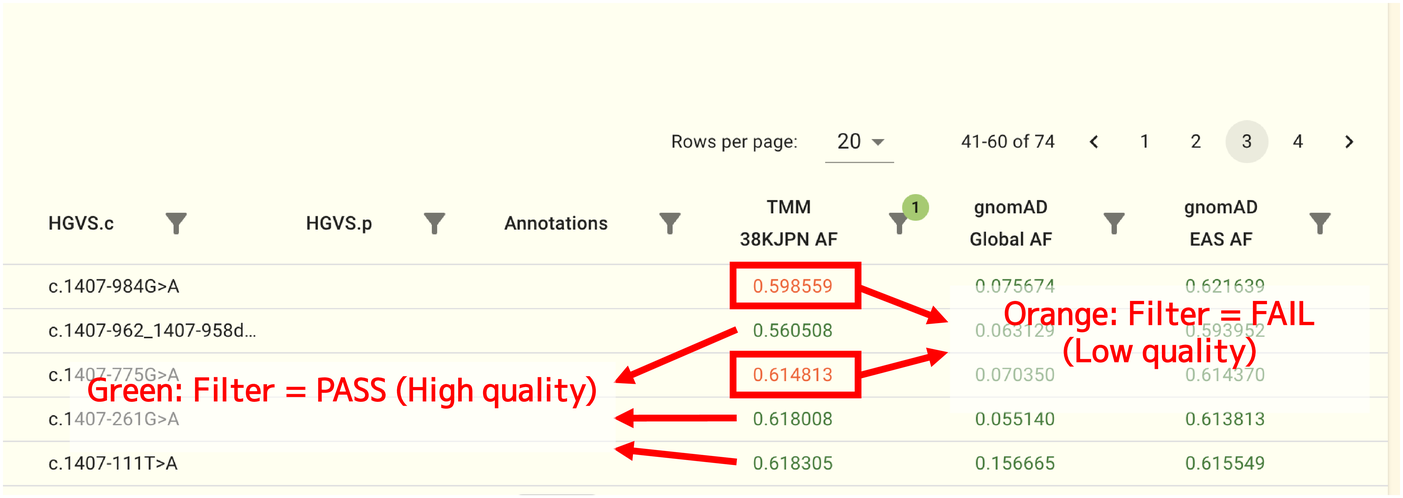
Note
The TMM whole genome panel uses the VQSR filtering approach to assess the quality of SNVs and INDELs. For more information on the filtering method, see https://gatk.broadinstitute.org/hc/en-us/articles/360035531612 and DePristo et al. [14]. The gnomAD datasets use a different filtering strategy. For more information about gnomAD dataset,s see Karczewski et al. [15].
2.1.3. SNV/INDEL density panel
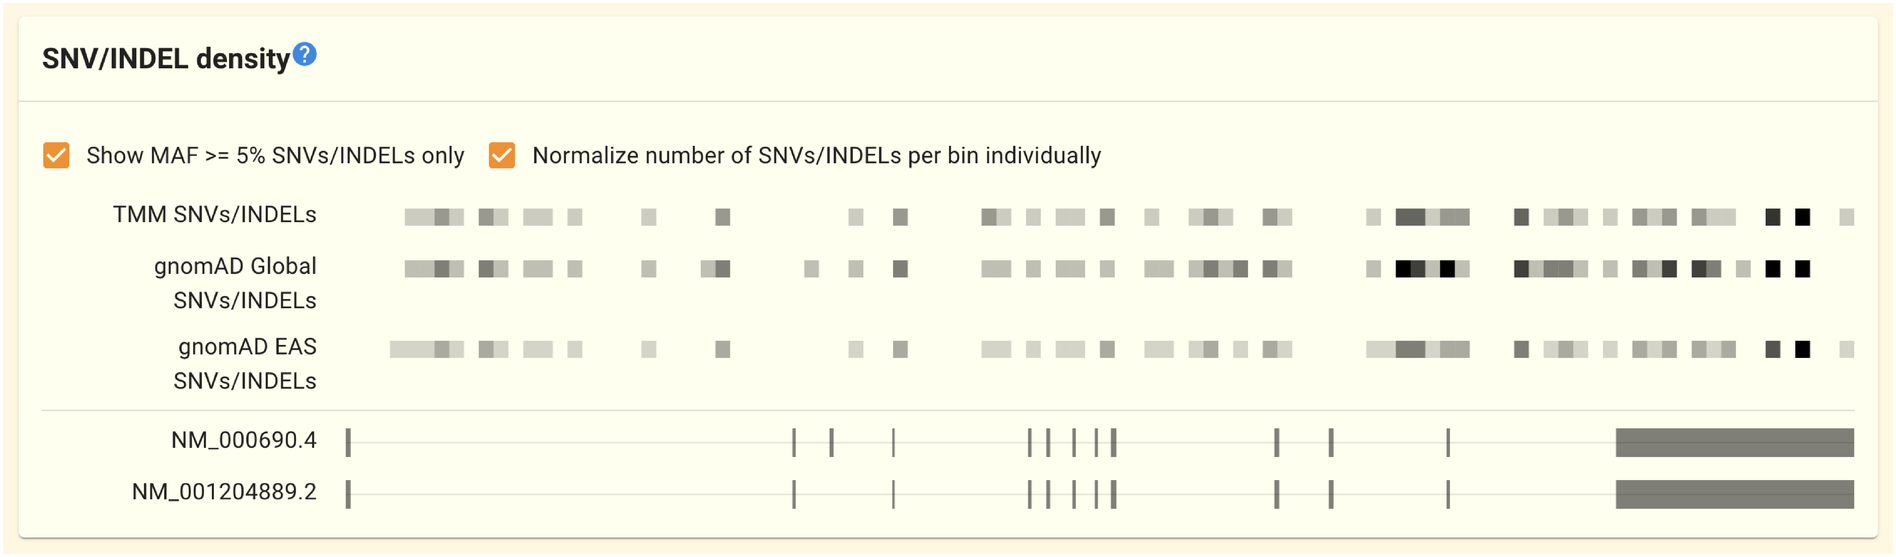
この節は鋭意執筆中です
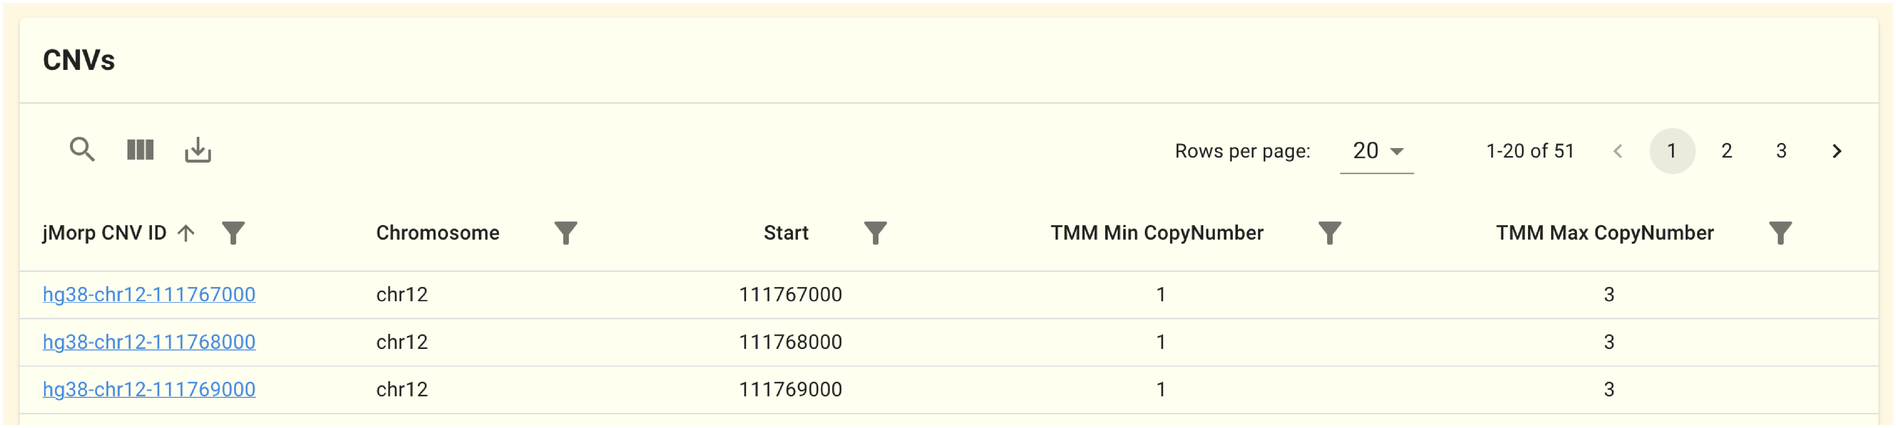
2.1.4. CNV panel
このパネルにはこの遺伝子領域に重なるCNVの検出領域が表示されます。データは JCNVv1 データセットのものを元にしています。 ゲノム全体を1kbpごとにbinに切った領域単位でCNVを計算しており、このパネルには場所とコピー数の最小値、最大値が表示されています。 jMorp CNV IDをクリックすると、 CNV page に移動し、コピー数のヒストグラムが表示されます。
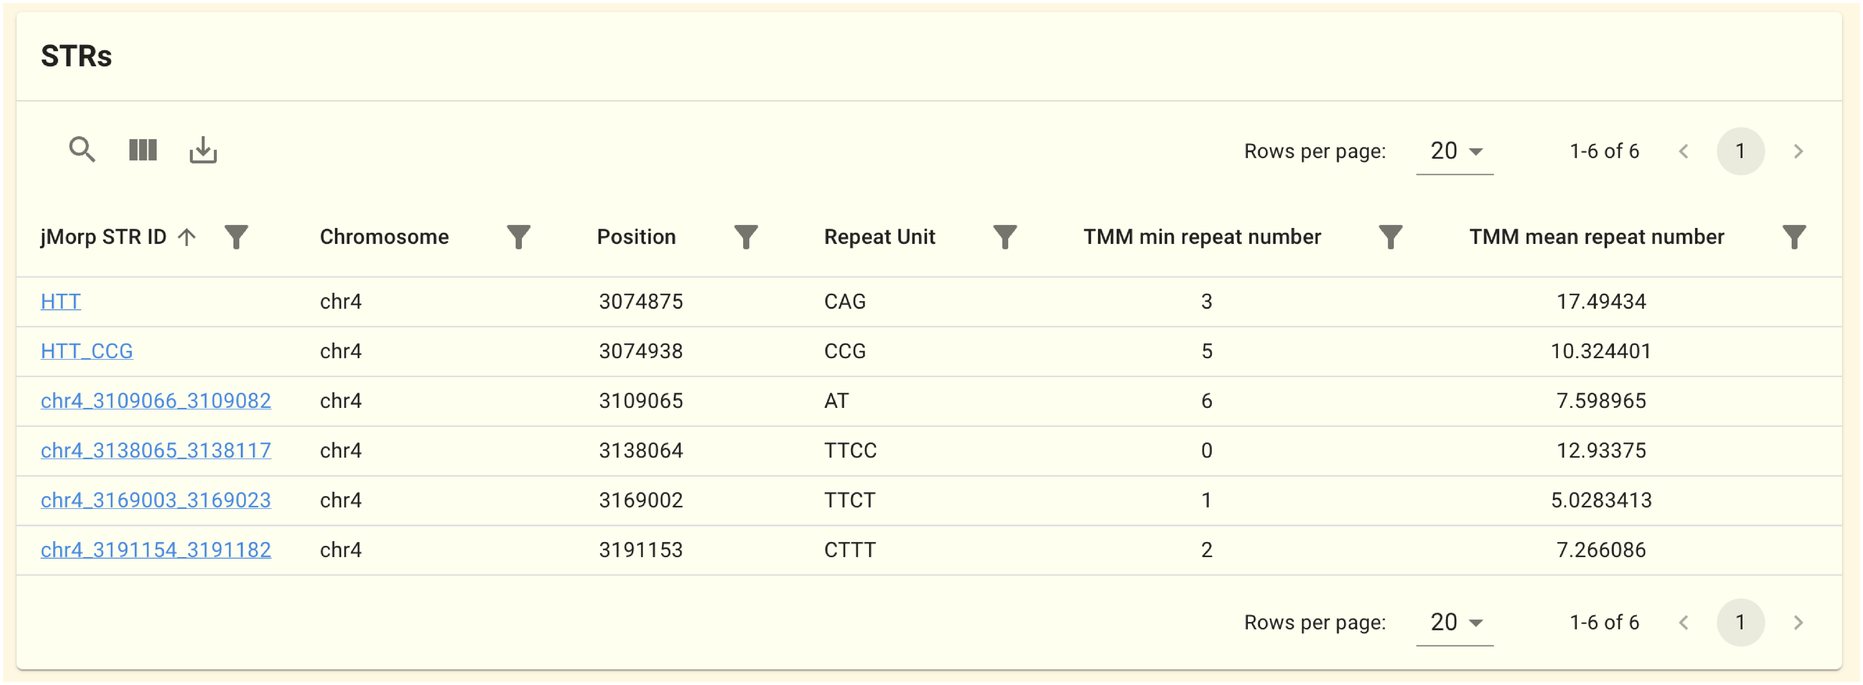
2.1.5. STR Panel
This panel displays the Short Tandem Repeat (STR) detection region that overlaps this gene region. The data is based on the 61KJPN-STR . STRs are from the STR Catalogs , so some STRs may not be displayed for some genes because the overlapping STR does not exist. Clicking on a jMorp STR ID will take you to the STR Page, where a histogram of the number of repeats is displayed.
2.1.6. Methylation information panel
Information on the methylation sites found on this gene is shown in this panel. The IMM 3cell analysis dataset is the source of the data. For each genomic position and each cell type (CD4T, Mono, Neu), the mean, variance, and Reference Interval (RI) of the methylation rates are displayed.
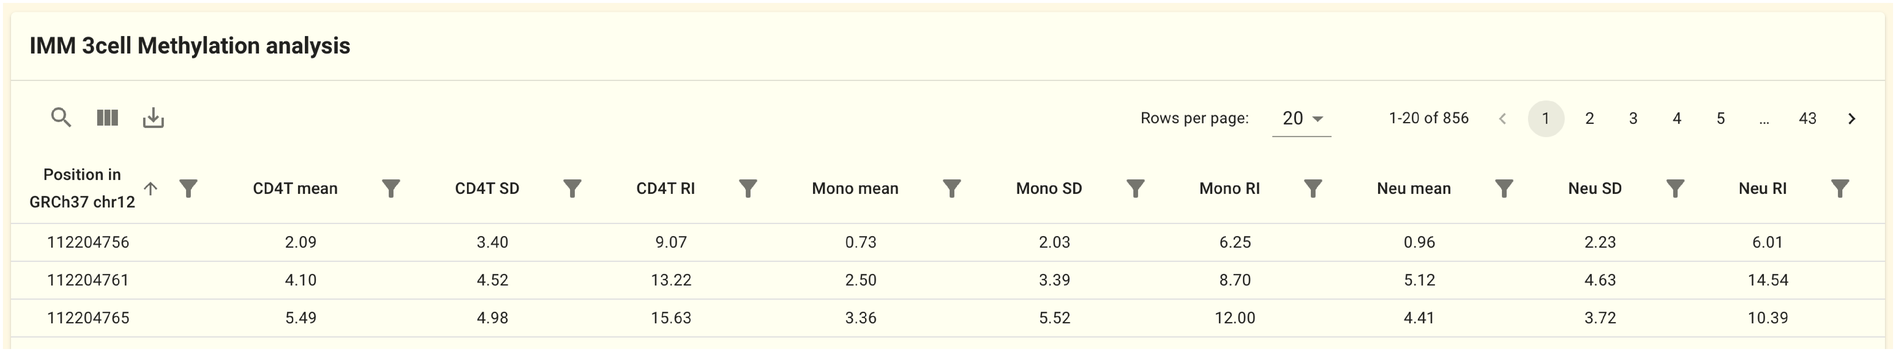
Note
The methylation analysis data from the IMM 3cell analysis dataset uses GRCh37 as the reference sequence. As a result, the information in this panel is only available when viewing the GRCh37 version of the gene page. Follow the instructions in the notice that is shown at the top of the gene page to switch the reference genome.
2.1.7. Gene expression panel (ToMMo whole blood)
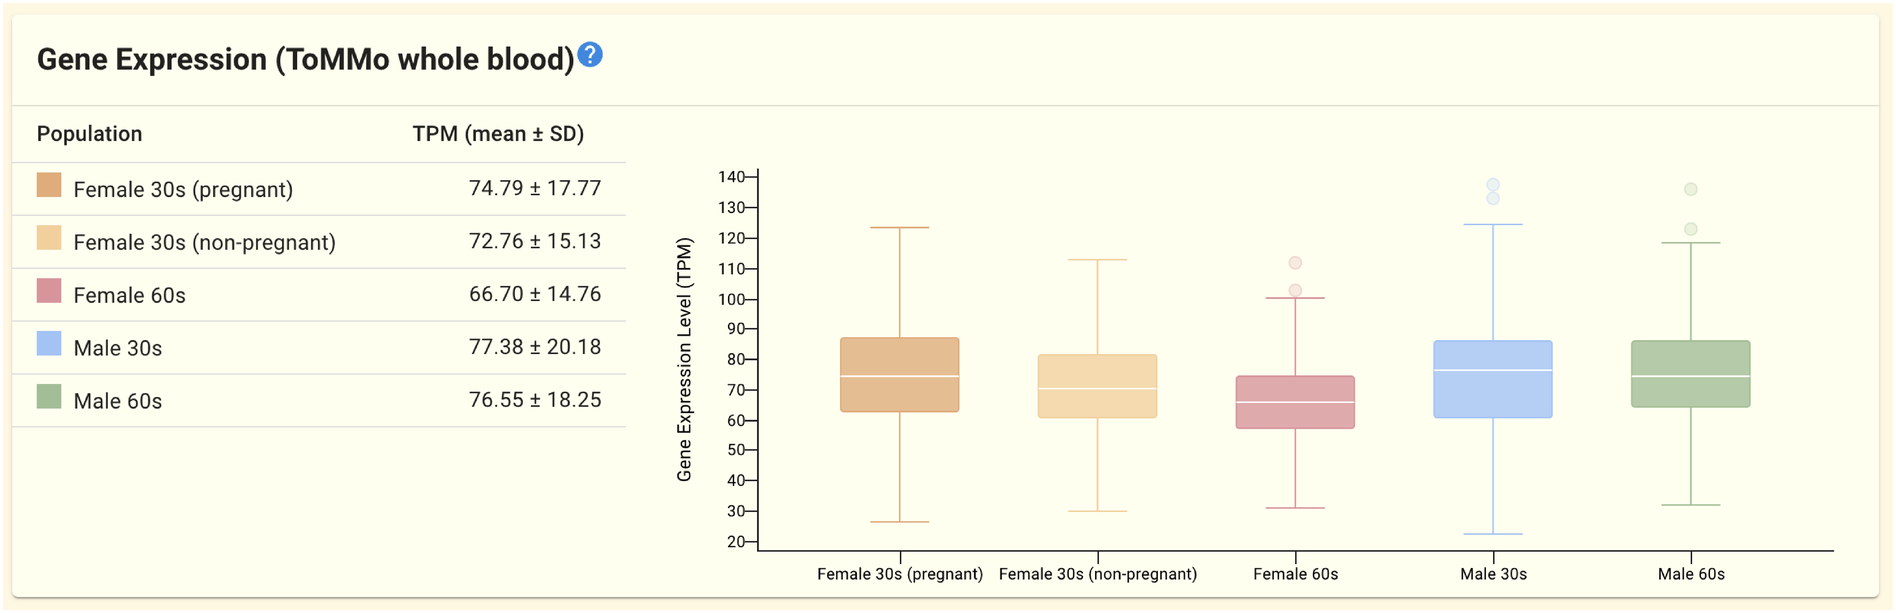
This panel displays gene expression data from the ToMMo whole blood dataset. Gene expression (TPM) statistics (mean and standard deviation) and box plots are displayed for five populations stratified by gender and age (pregnant women in their 30s, non-pregnant women in their 30s, women in their 60s, men in their 30s, and men in their 60s).
2.1.8. Gene expression panel (IMM 3cell analysis)
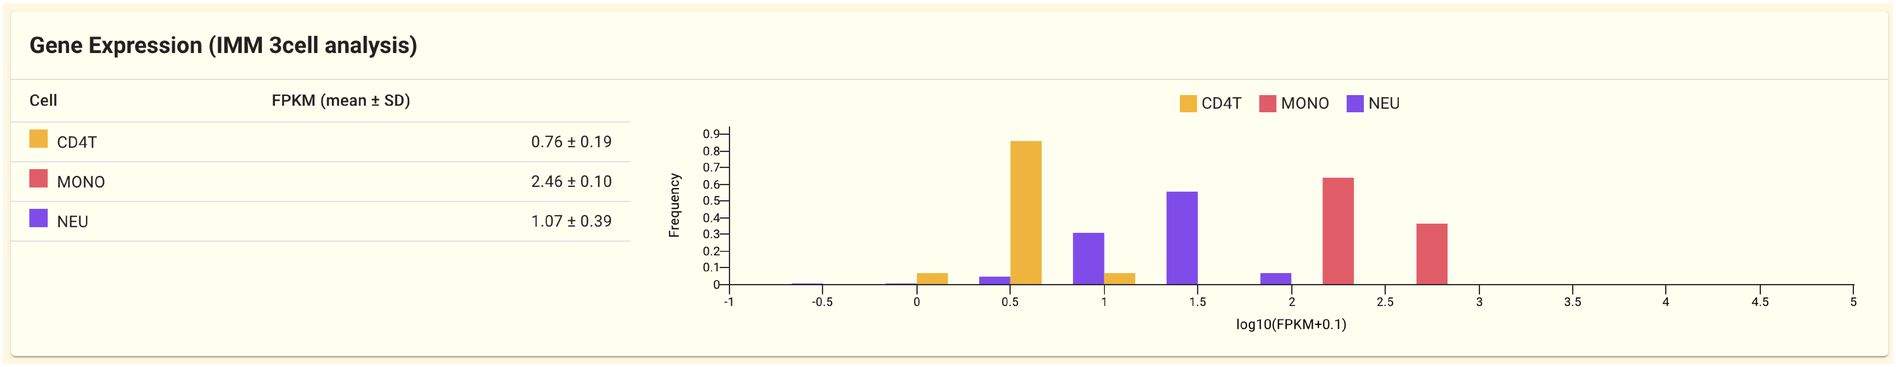
The gene expression data from the IMM 3cell analyis dataset is shown in this panel. Gene expression is measured by cell type in the IMM 3cell analysis dataset (CD4T, Mono, Neu).
2.1.9. Gene expression panel (ToMMo ISO-Seq)
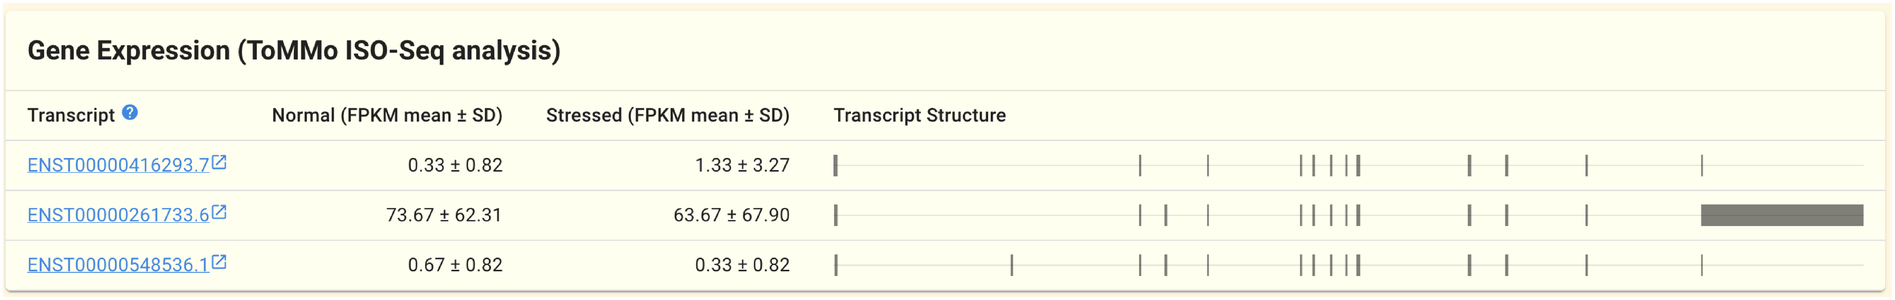
The ToMMo ISO-Seq dataset’s gene expression information is shown in this panel. The gene expression data generated by by PacBio RS-II sequencer’s long-read transcriptome analysis (known as isoform sequencing; ISO-Seq) is included in the ToMMo ISO-Seq dataset.
The FPKM values (mean and standard deviation) are shown depending on whether the cells are under stress or not, and each row of the table represents one transcript.
On the right side of the table, a simple diagram illustrating the structure of each transcript is also shown. Exons are represented by the squares, and when you hover your cursor over them, their coordinates are shown.
2.1.10. Genome browser panel
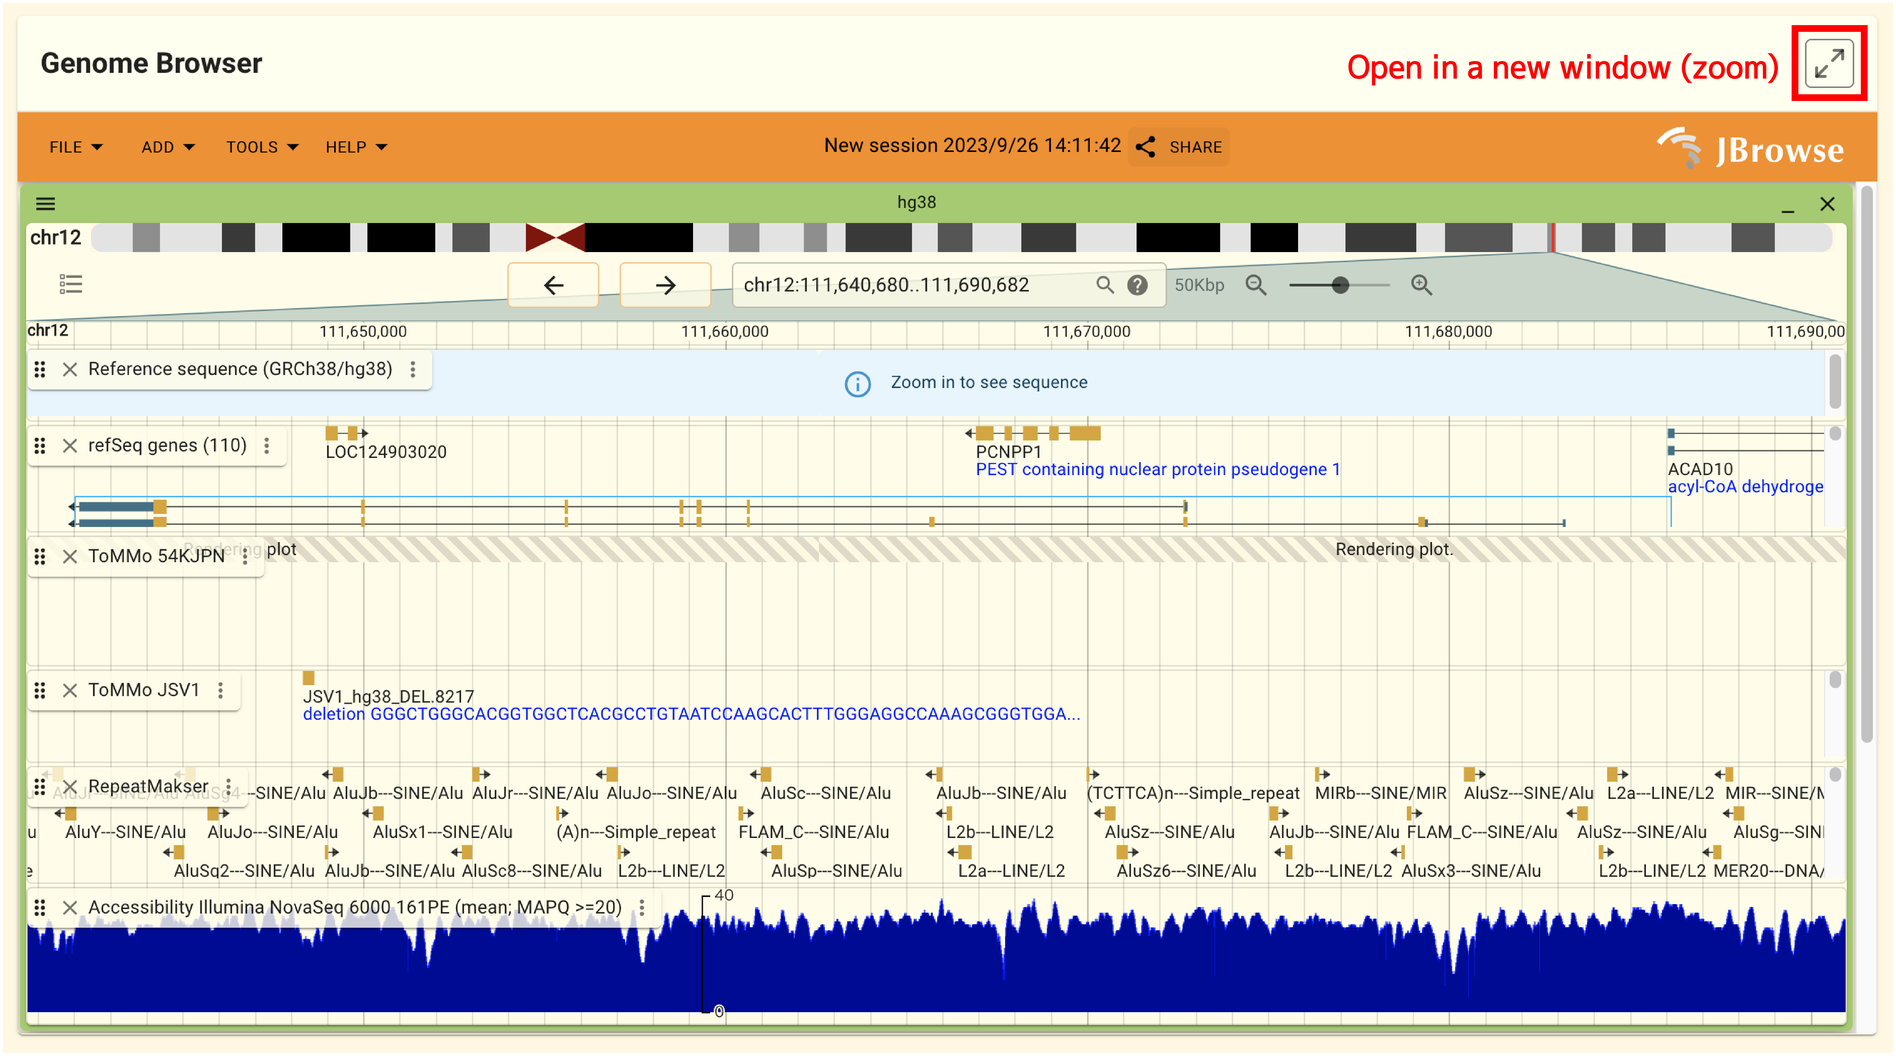
The genome browser in this panel allows users to view gene regions. By clicking the arrow icon in the panel’s top right corner, the genome browser will open in a separate window. The genome browser’s interface is explained in another section.
2.1.11. GWAS analysis results panel
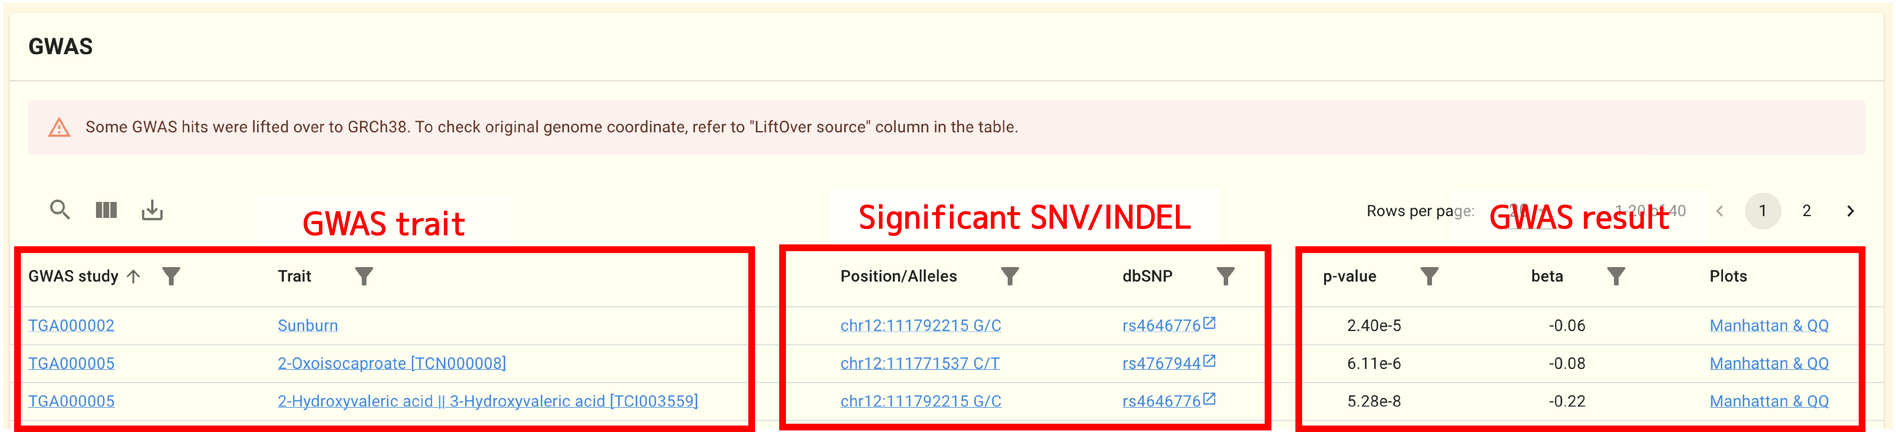
SNVs and INDELs related to this gene are collected from the jMorp GWAS repository and displayed in this panel.
Note
Most of the GWAS summary statistics files in the jMorp GWAS repository are written in GRCh37. In order to search and display GWAS analysis results on the gene page without being aware of differences in reference genomes, LiftOver may be performed for GWAS summary statistics files in the GWAS analysis results panel. In this case, the LiftOver source column of the table displays the original genome coordinates.
2.1.12. HLA allerle frequency panel
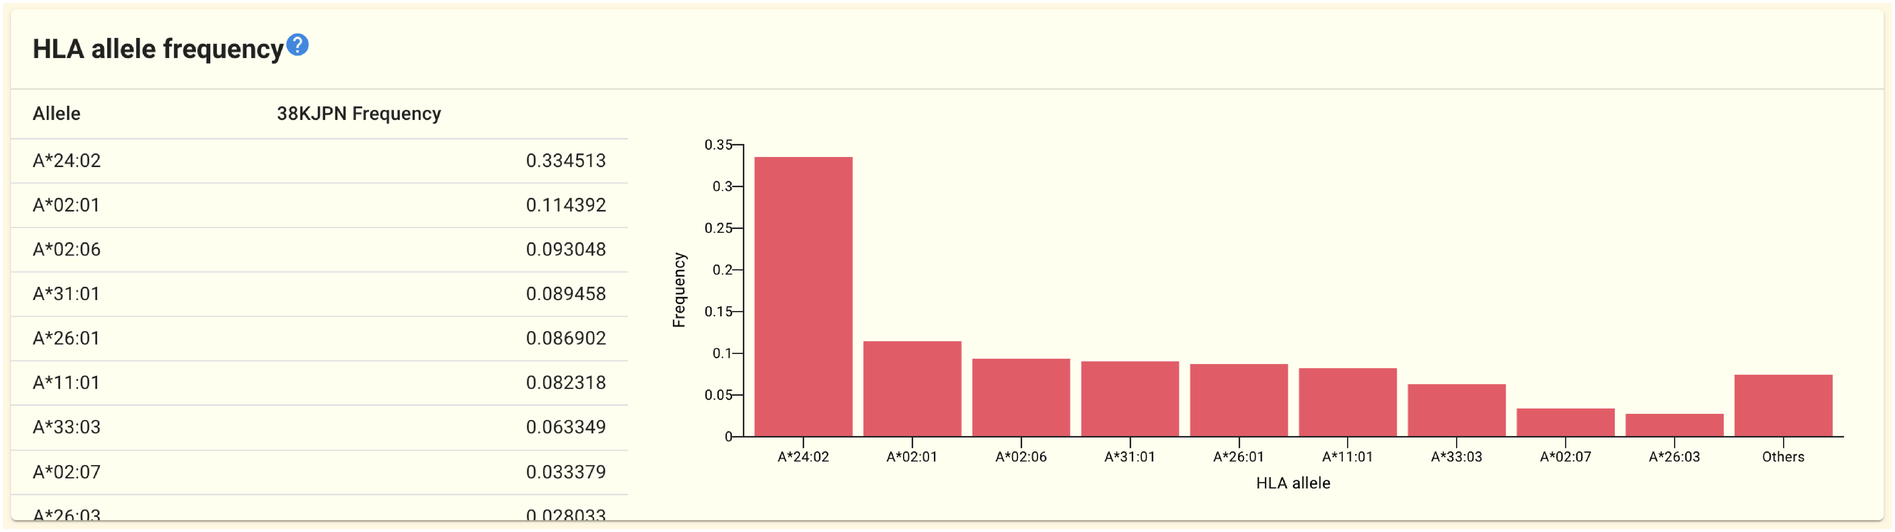
On the gene page for HLA-related genes like HLA-A and HLA-B, the HLA allele frequency panel is shown. The 51KJPN-HLA dataset is used to obtain the frequency data. The HLA allele frequency panel from the HLA-A gene page is shown above as an example.
2.1.13. PGx panel
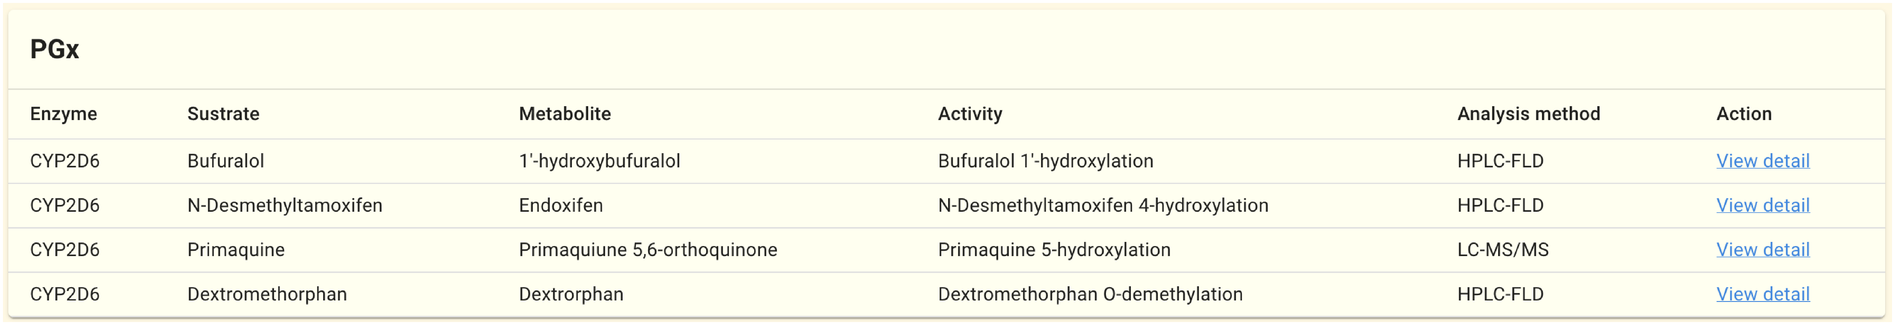
On the gene pages of genes related to drug metabolism, like CYP2D6, links to the results of the PGx analysis are displayed. For details on how to use PGx data, refer to the PGx page and the PGx dataset details. The PGx panel from the CYP2D6 gene page is shown above as an example.