2.11. PGx page
The PGx page of jMorp presents the results of in vitro analysis of enzyme activity changes for 14 drug-metabolizing enzymes with genome variations associated with 382 amino acid substitutions associated with drug susceptibility.
2.11.1. Access to PGx data
To view a list of PGx data, select Pharmacogenomics (PGx) from the menu on the right side of the jMorp home page.

The table contains drug-metabolizing enzymes and their corresponding genes, substrate drugs, metabolites, as well as methods of metabolite analysis. Clicking on the View detail link in the table will take you to a page with details about in vitro analysis of each drug metabolizing enzyme and a list of genome variations analyzed (hereafter referred to as the detail page).
Tip
As previously mentioned, you can access PGx data by clicking the PGx link on the top page. Alternatively, you can also search by substrate name or metabolite name using the top page’s search box. In addition, a link to the PGx data will be automatically shown on the gene page of each gene that codes for a drug-metabolizing enzyme.
2.11.2. Detail page
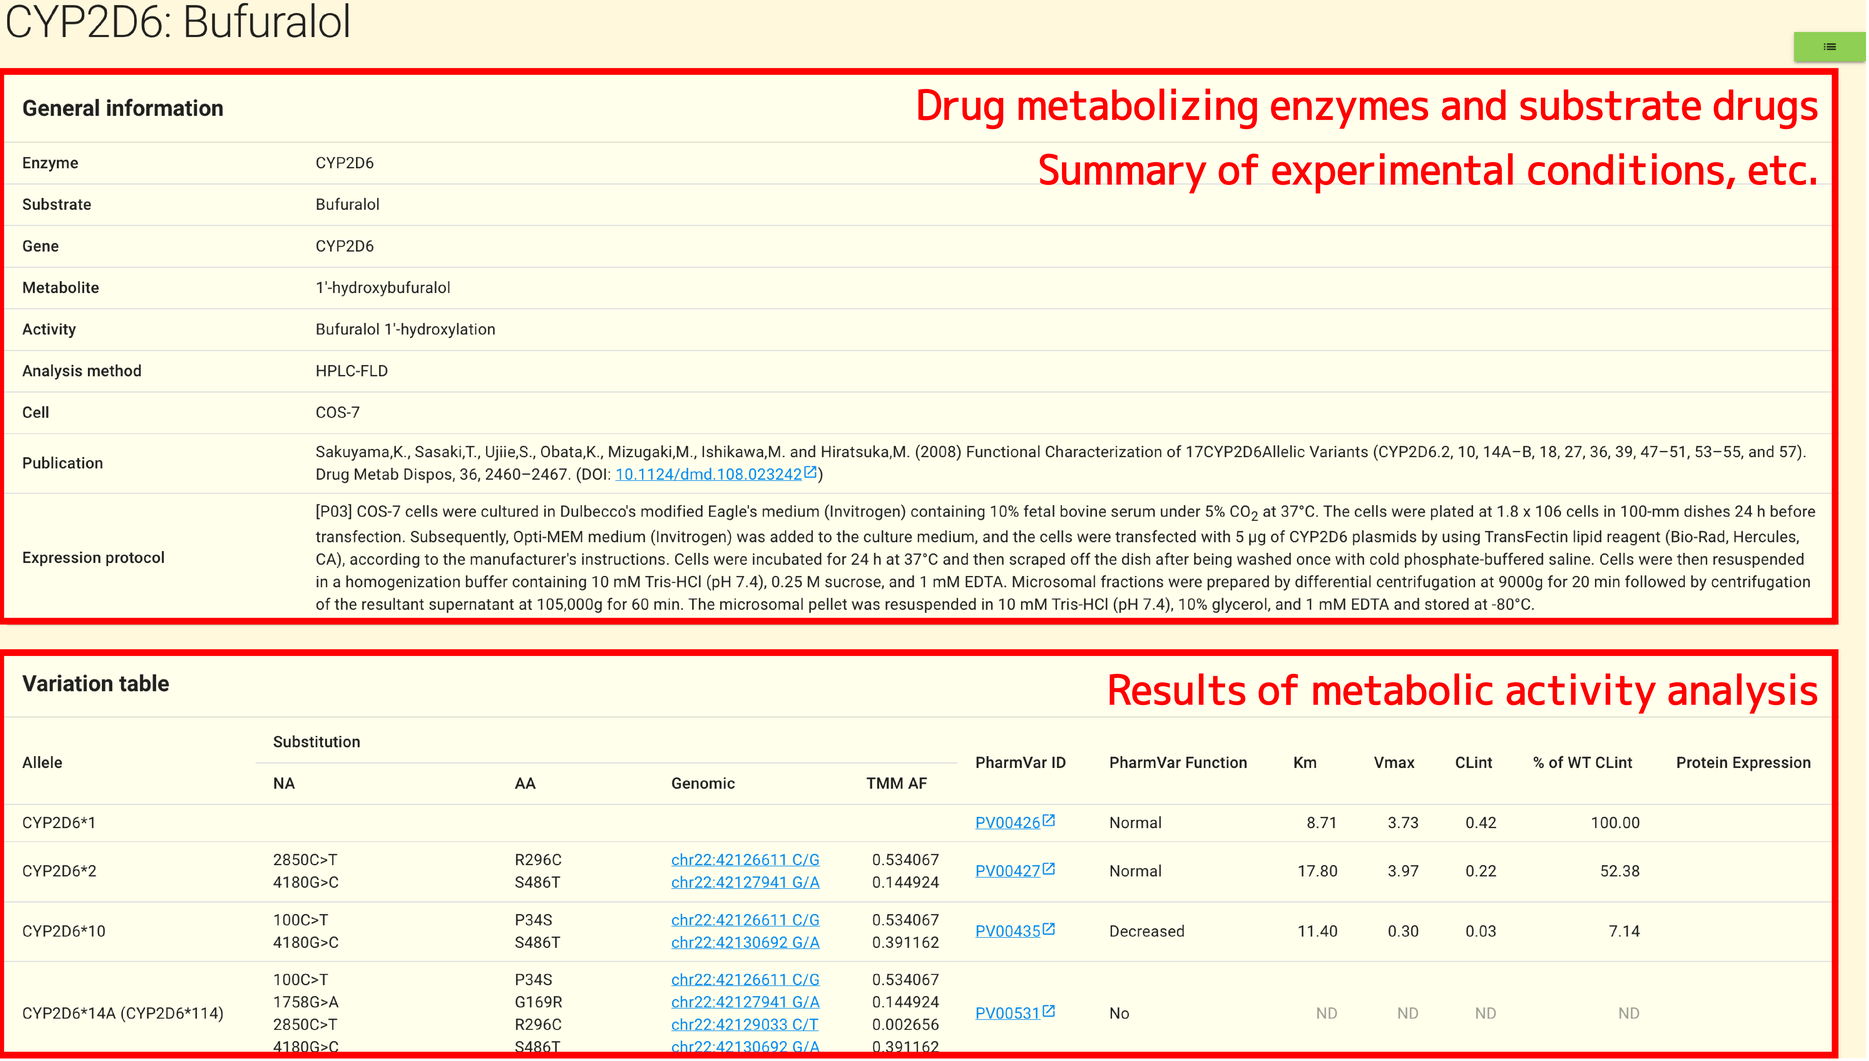
A General information panel and a Variation table panel are available on the detail page.

The following information are shown on the General Information panel.
Enzyme: name of the drug-metabolizing enzyme
Substrate: substrate name
Gene: name of the gene that encodes a drug-metabolizing enzyme
Metabolite: name of a metabolite produced by a metabolic reaction
Activity: reactions that produce metabolites from a substrate drug
Analyze Method: a method that measures metabolite concentrations
Cell: cell lines used for expression of variant enzyme
Publication: a list of publications
Expression protocol: details of expression protocols
The following information are shown in the Variation table panel.
Allele: allele name
NA Substitutions: substitutions of nucleotides corresponding to the allele
AA Substitutions: substitutions of amino acids corresponding to the allele
Genomic Substitution: the positions of the genome variations in the reference genome corresponding to the allele. Clicking on the genome variation name will take you to the SNV/INDEL page of jMorp
TMM AF: allele frequencies in the TMM whole genome reference panel.
PharmVar ID: PharmVar ID of a non-synonymous SNV; click on the ID to go to PharmVar.
PharmVar Function: function of the variation derived from the PharmVar database
Km: Michaelis constant determined by in vitro analysis. Index of affinity between metabolic enzymes and substrates
Vmax: maximum reaction rate of enzyme reaction determined by in vitro analysis
CLint: intrinsic clearance (Vmax/Km) determined by in vitro analysis. It is a measure of the degree of enzyme activity, and the higher value indicates the higher enzyme activity.
% of WT CLint: percentage of variant CLint for wild type CLint (%)
Protein Expression: variations with severely reduced expression of enzyme proteins are listed as Low
Note
TMM AF allele frequencies originate from either 8.3KJPN (GRCh37) or 54KJPN (GRCh38). Depending on which reference genome is chosen, one of them is shown. Above the table, you can see the reference genome currently selected.