2.10. MRI page
In jMorp, we provide a page where you can explore the volumes of brain regions analyzed using FreeSurfer and based on the ASEG atlas. This page allows you to view analysis information such as frequency distribution, trends by age and sex, and temporal changes for each region.
By searching for the region name in the search box on the jMorp homepage, you can access the corresponding page for that brain region. Additionally, clicking on MRI2024 on the right side of the jMorp homepage will display a list of MRI data sorted by attributes.
GLOBAL MEASURES tab
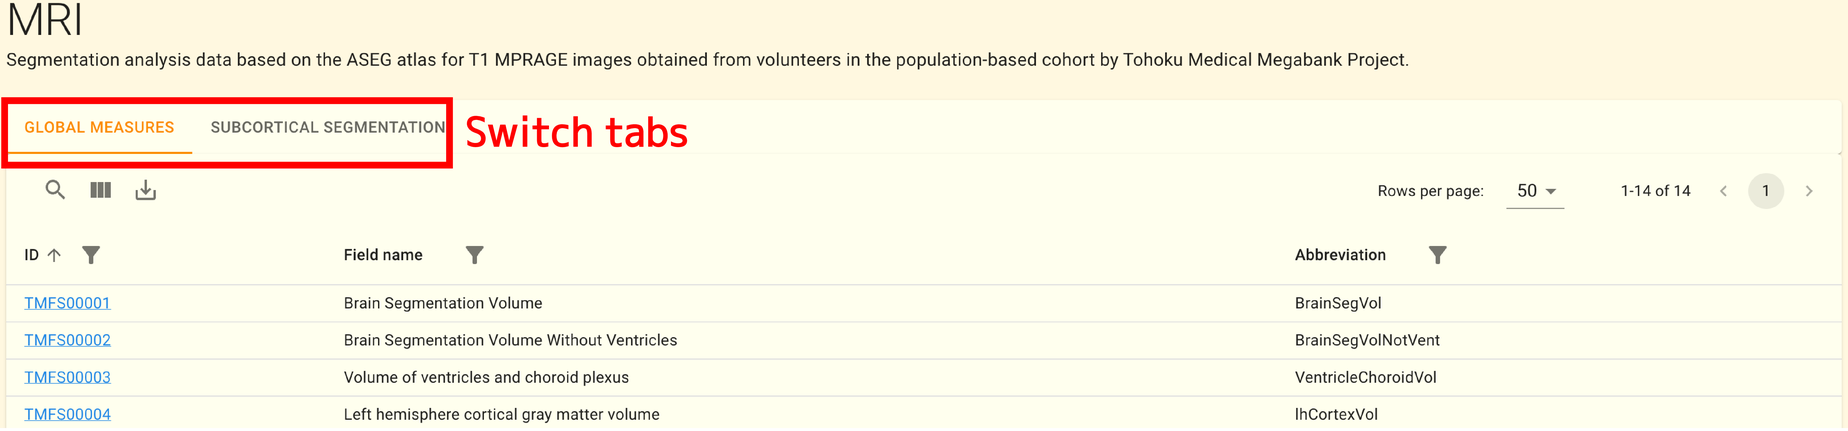
The data contained in this tab consists of statistics related to all brain regions.
SUBCORTICAL SEGMENTATION tab
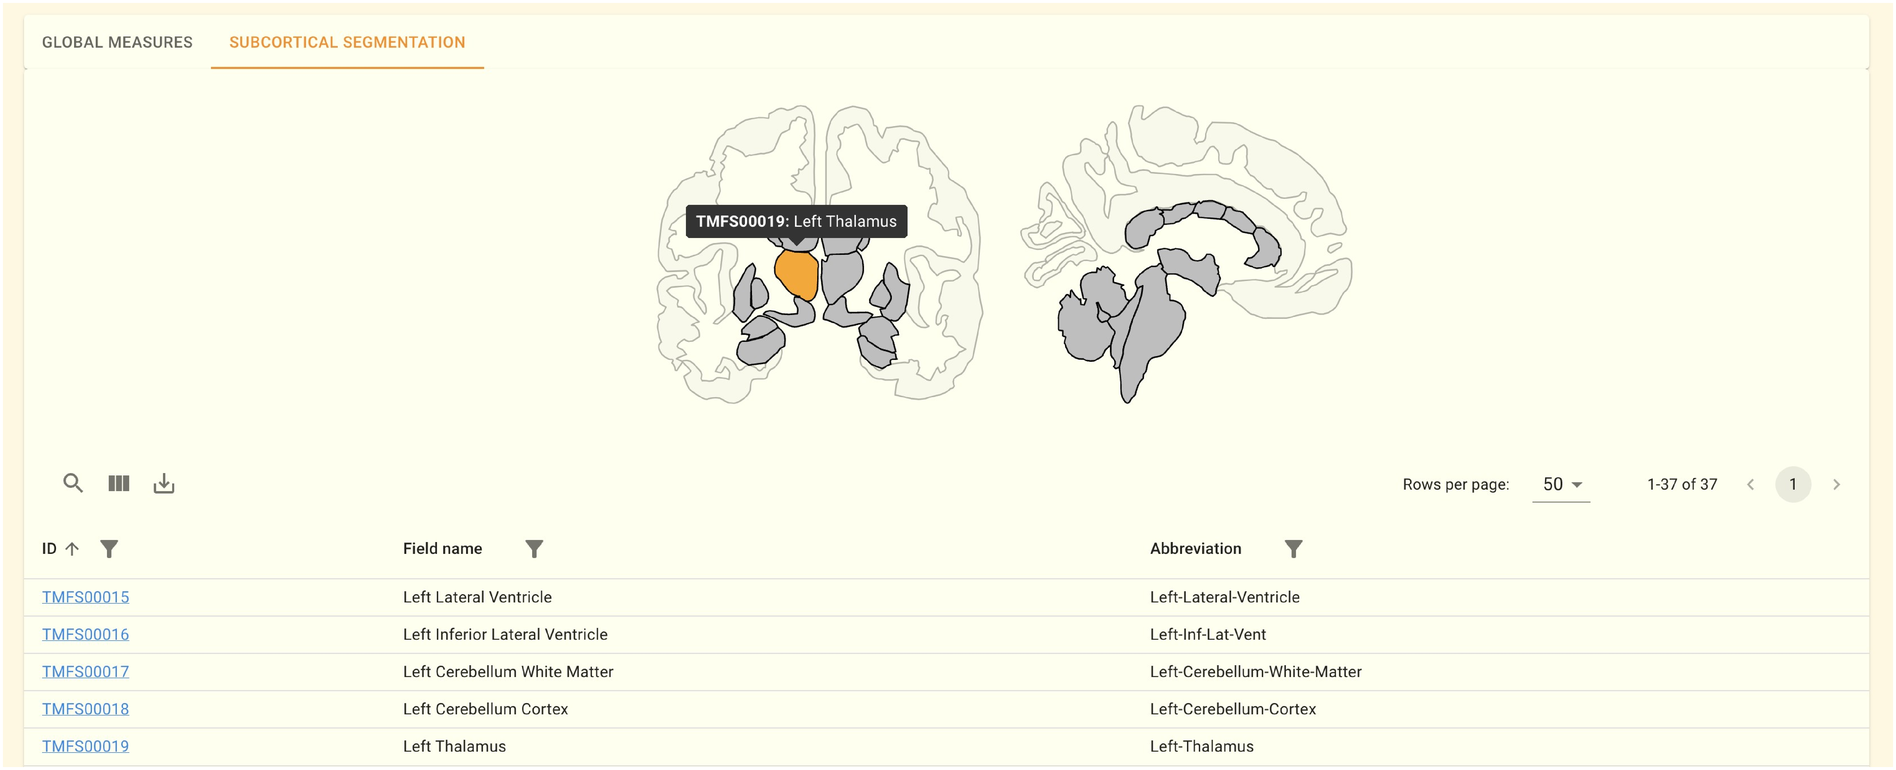
The data included in this tab provides information about each subcortical region of the brain. When the mouse cursor is placed over the corresponding region on the image, the ID and region name are displayed, and clicking on it will navigate to the page for the selected region.
The following sections describe the content of each panel using Left Lateral Ventricle from the SUBCORTICAL SEGMENTATION Tab as an example. For information about the dataset itself, please refer here.
Note
Each brain region image was created using the following software packages:
R Core Team (2023). R: A Language and Environment for Statistical Computing. R Foundation for Statistical Computing, Vienna, Austria
H. Wickham, ggplot2: Elegant Graphics for Data Analysis, Springer-Verlag New York, 2016 [19]
Athanasia M. Mowinckel and Didac Vidal-Piñeiro, Visualisation of Brain Statistics with R-packages ggseg and ggseg3d, Advances in Methods and Practices in Psychological Science, 2020 [20]
2.10.1. Field information panel
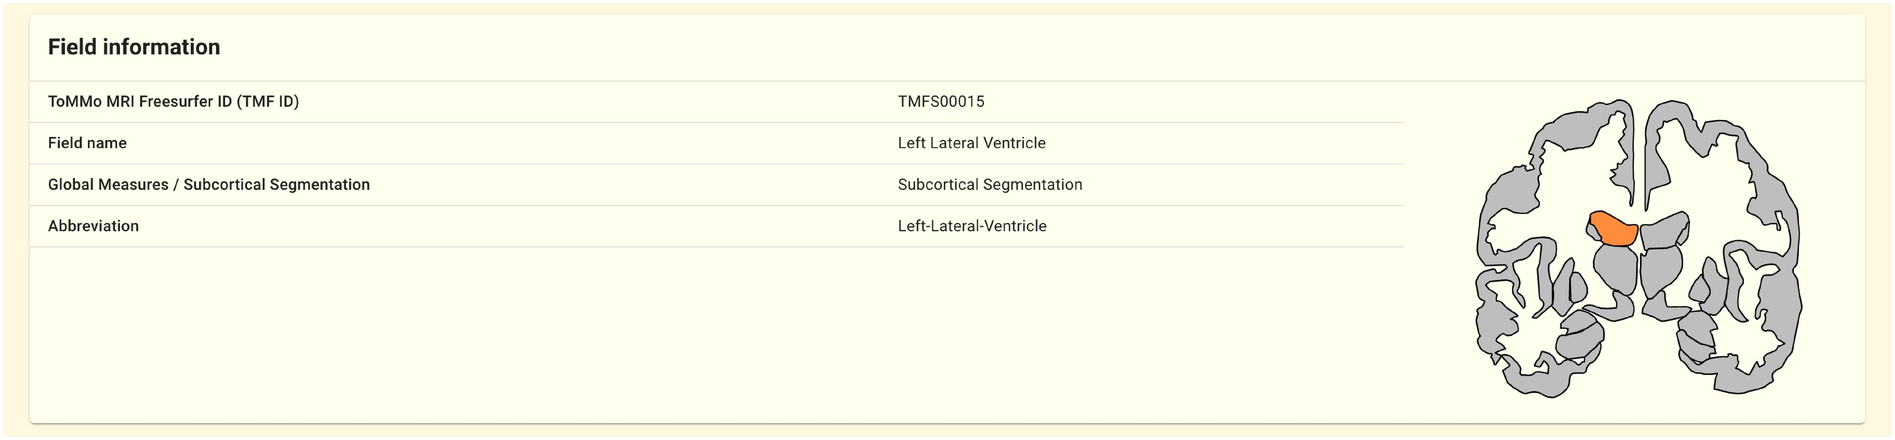
This panel displays basic information about the region, including region ID, field name, attribute information, and abbreviation.
2.10.2. Volume distribution panel
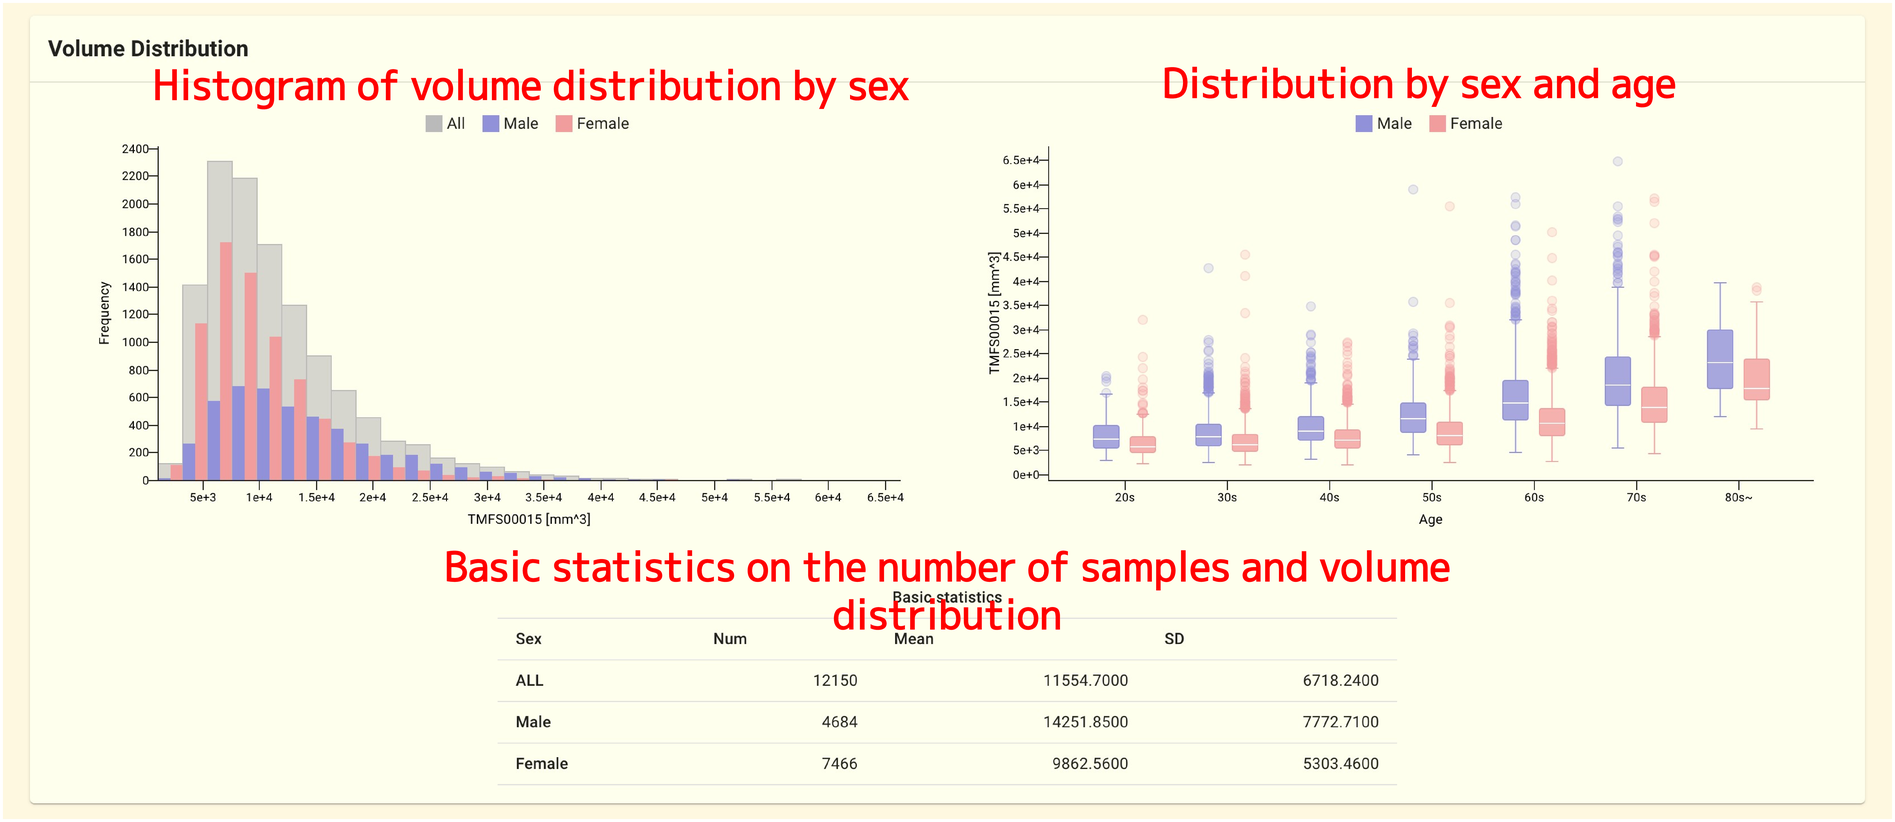
This panel displays volume distributions by sex and age group.
2.10.3. Repeat assessment panel
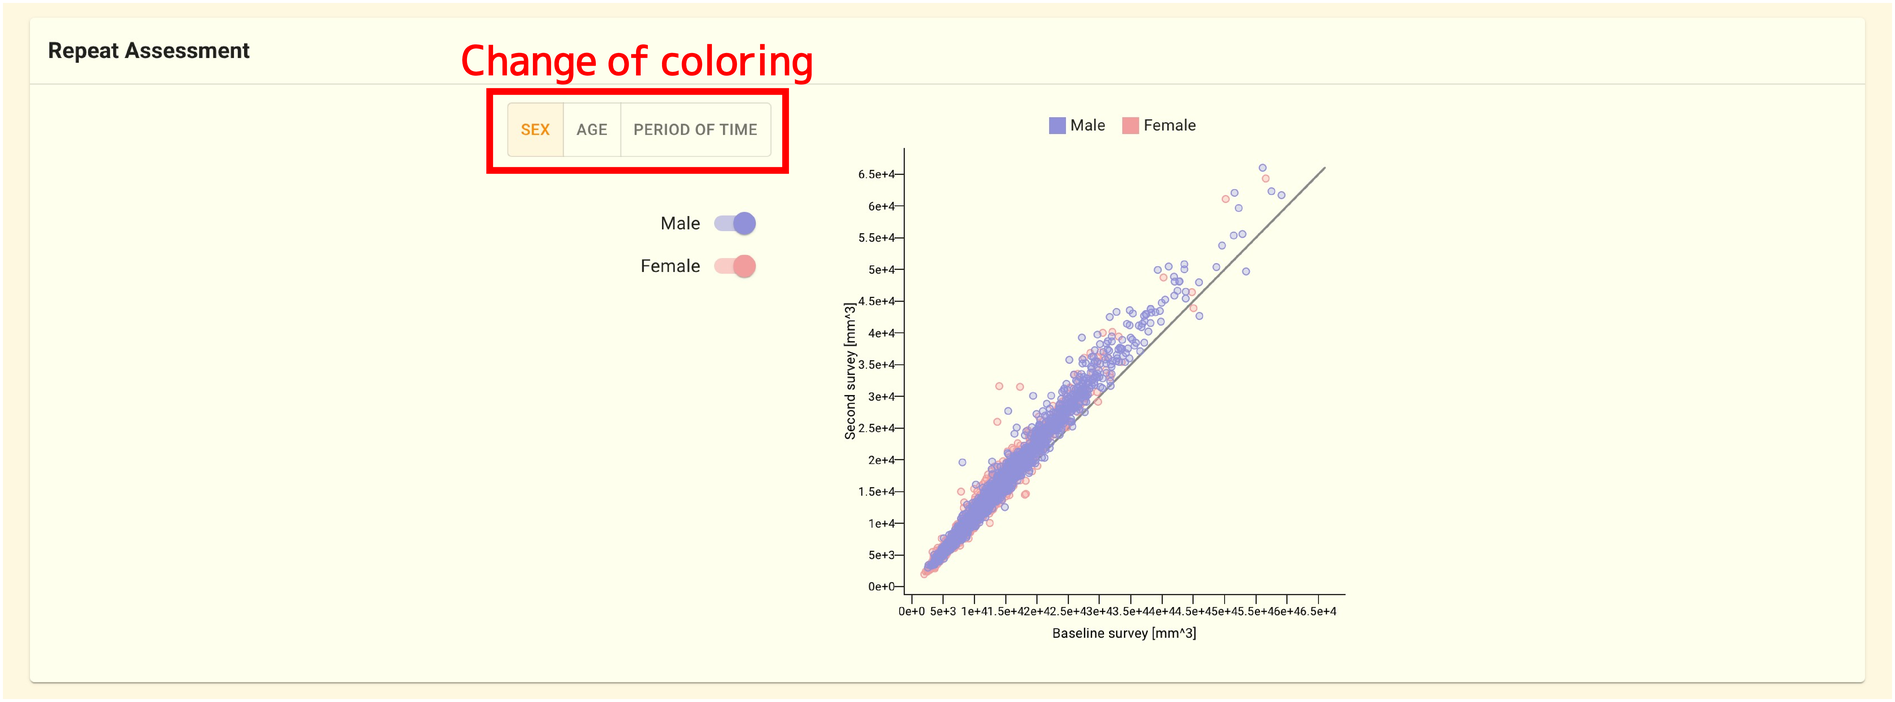
In this panel, the volumes of brain regions obtained at intervals over several years in a cohort study are displayed, with the initial volume on the horizontal axis and the second volume on the vertical axis. By selecting the box in the top left corner of the plot, data can be color-coded by sex, age group, and interval of acquisition.
2.10.4. Volume distribution summary panel
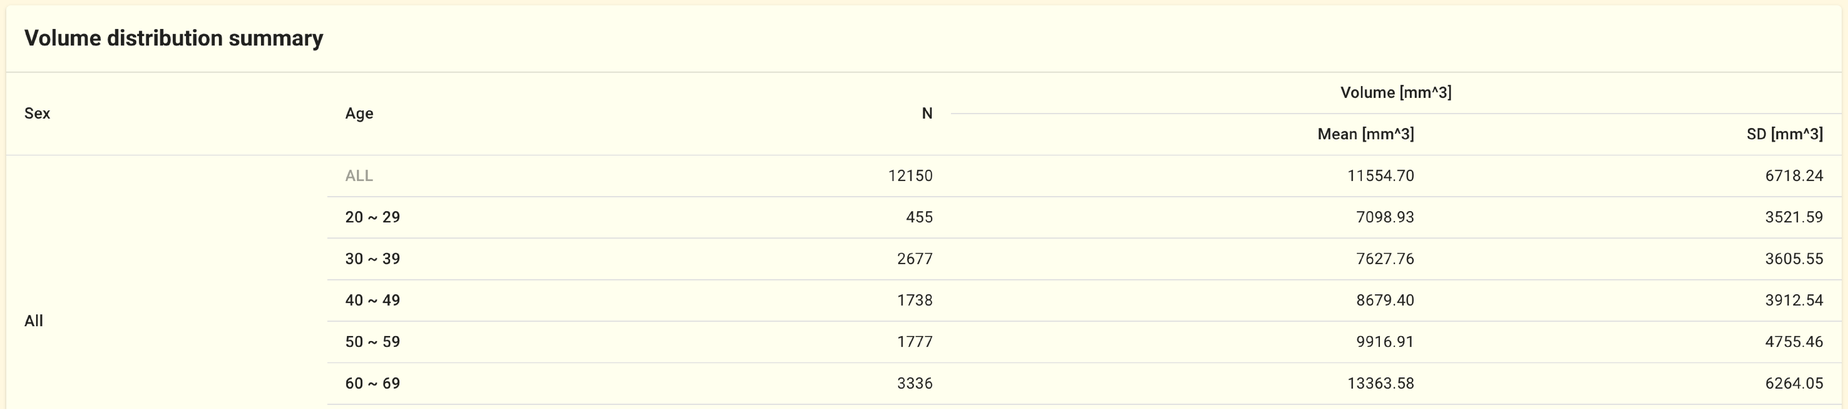
This panel displays indicators stratified by age and sex.