2.3. SNV/INDEL allele frequency comparison tool
The SNV/INDEL allele frequency comparison tool graphically compares SNV/INDEL allele frequencies for each ethnic group. By specifying two populations and a genome region, SNVs and INDELs in the region are extracted from allele frequency panels and plotted in a two dimensional scatter plot.
You can navigate to the allele frequency comparison tool from the SNV/INDEL panel on the gene page. The figure below shows the allele frequency comparison tool for SNV/INDEL on ALDH2.
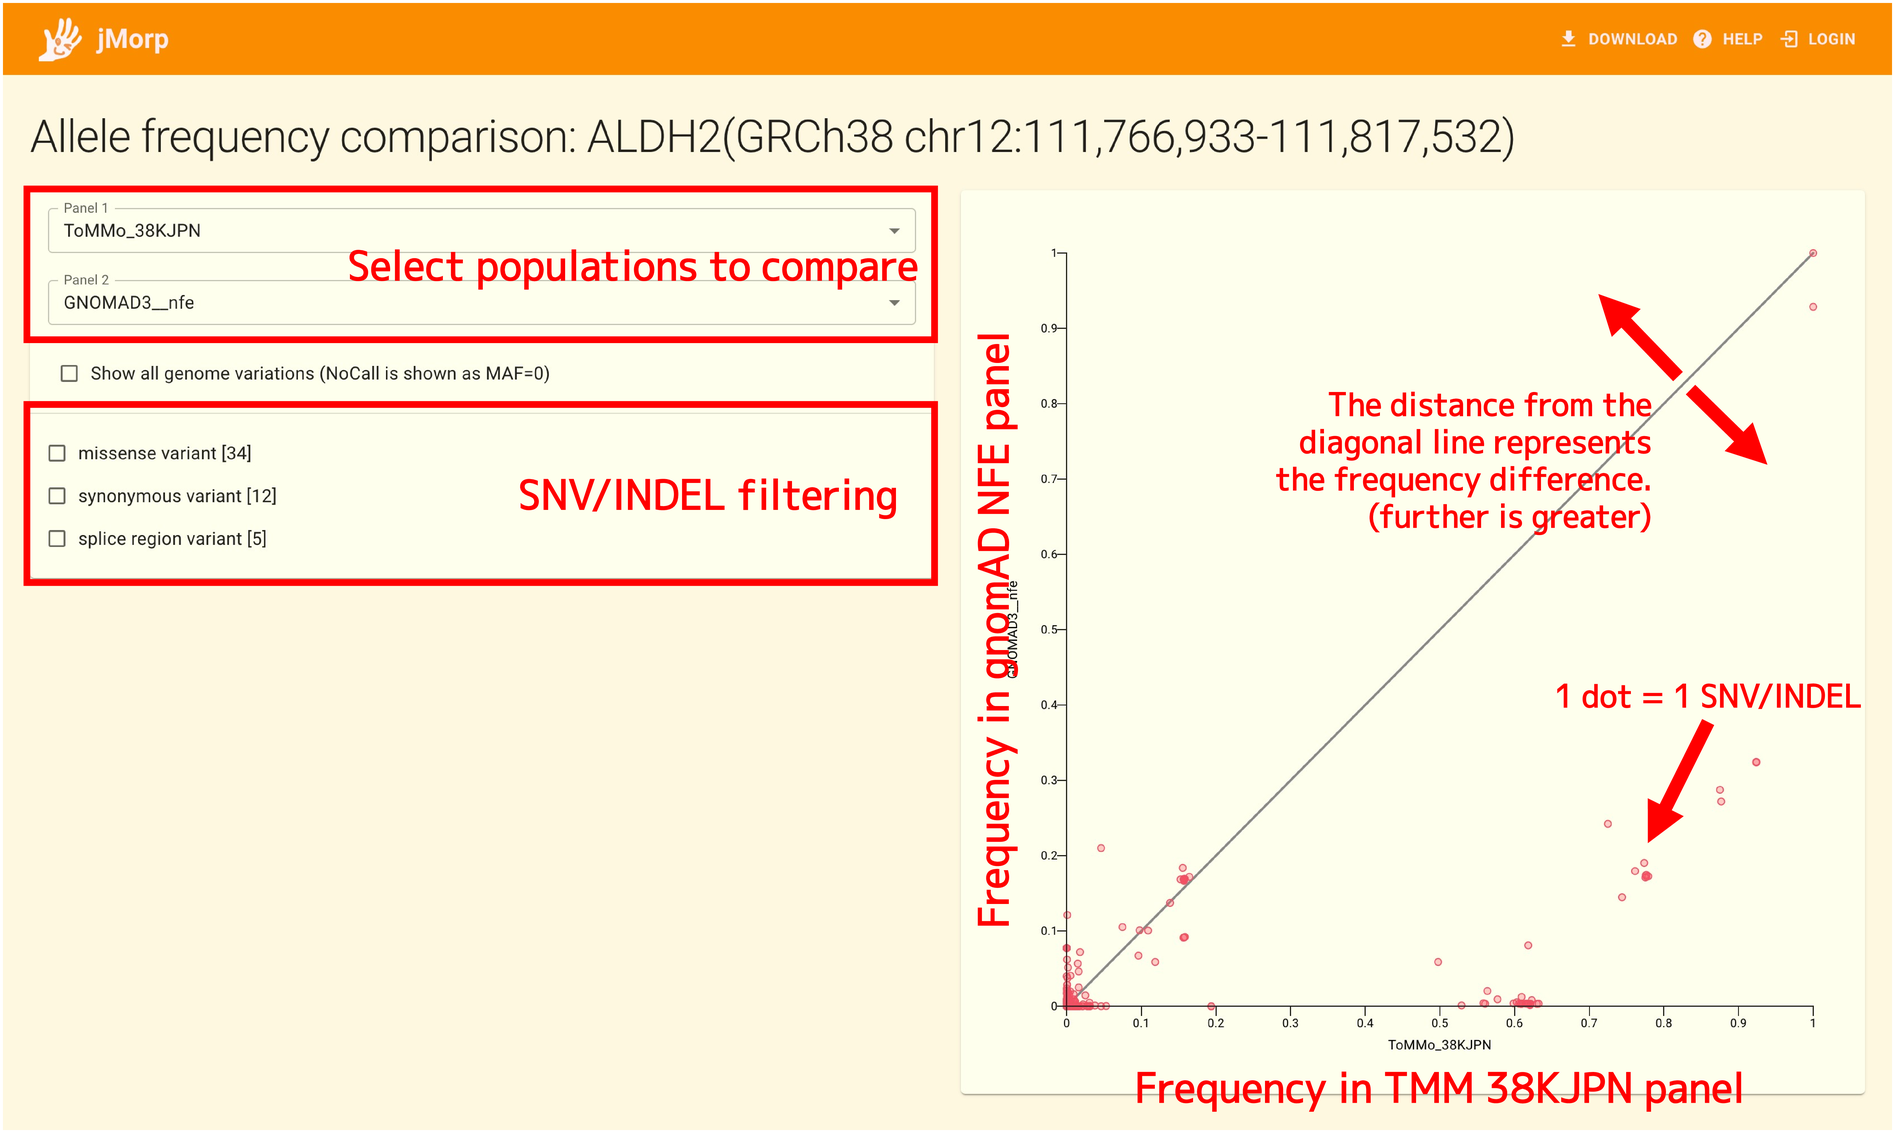
Select the two populations you want to compare using the selector in the upper-right corner of the page. In the figure above, ToMMo 38KJPN and gnomAD NFE (Non-Finnish European) are selected. The population selected here corresponds to the horizontal and vertical axes of the plot on the right side of the page.
In the plot on the right side of the page, one dot corresponds to one SNV or INDEL, and the vertical and horizontal axes represent the allele frequency of the SNV or INDEL in each population.
On the plot, a diagonal line is drawn. The allele frequencies of SNV/INDEL in the two populations are equal if the dots in the plot are close to the diagonal line; on the other hand, the frequency difference is large if the dots are far from the diagonal line. In the above figure, most of the dots in the plot are located below the diagonal line, so we can see that when comparing the allele frequency of SNV/INDEL on ALDH2 between ToMMo 38KJPN and gnomAD NFE, the allele frequency of SNVs and INDELs in ToMMo 38KJPN tends to be higher.
Point the cursor at a dot to see the corresponding SNV/INDEL and the allele frequencies in the two populations if you want to know specifically which SNV/INDEL has a significant difference in frequency. You can also check the gene annotations displayed in the lower left corner of the page to limit the plot to SNVs and INDELs with the selected annotations.